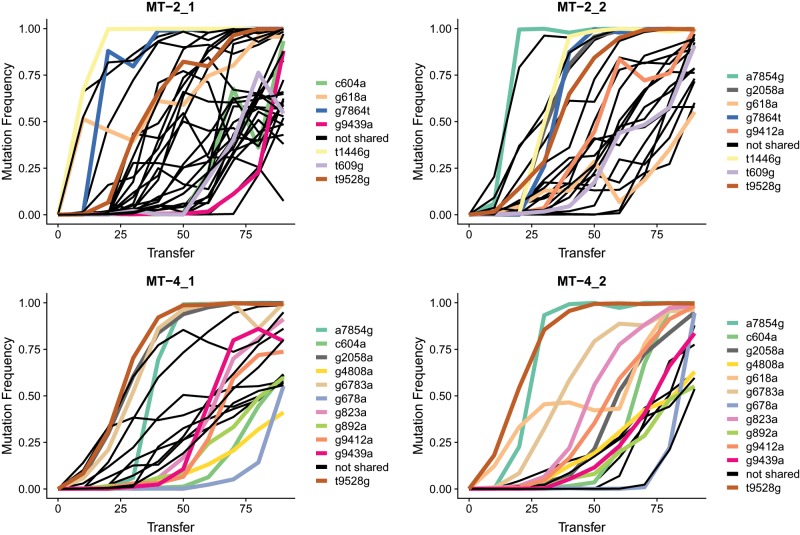
Fig. 3.
Frequency dynamics of majority mutations show decoupling of mutations. We observe decoupling when the mutation frequency dynamics of two mutations changes from being identical to becoming different. For example, in MT-2_1, there is a yellow and a black mutation that show the exact same frequency increase from transfer 0 to 10. At transfer 20, the mutation frequencies are different. Hence, at transfer 20, the two mutations decoupled probably through recombination. Colored thick lines in each of the four graphs indicate mutations that are acquired in more than one evolution line in parallel. The same mutations are drawn in the same colors. Black thin lines are majority mutations that are only found in a single line.

