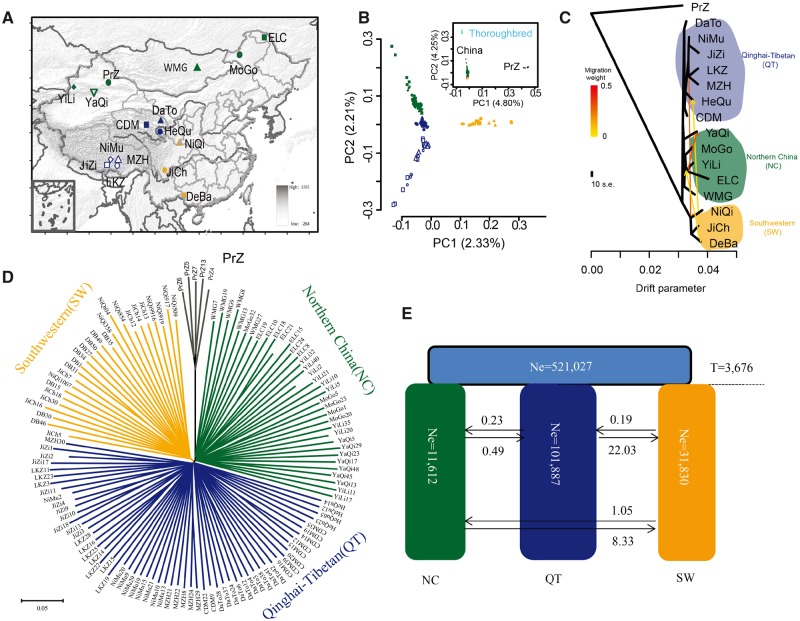
Fig. 1.
Geographic distribution, genetic structure and evolutionary relationships of Chinese native horse breeds. (A) The geographic distribution of 15 Chinese native horse populations and one Przewalski’s horse population (PrZ, black color). The blue color (hollow shapes) represents Tibetan horses (JiZi, Jiangzi; LKZ, Langkazi; MZH, Mozhu; NiMu, Nimu) living at least 4,000 m above the sea level (m.a.s.l.) whereas the blue color (solid shapes) represents Qinghai horses (CDM, Chaidamu; HeQu, Hequ; DaTo, Datong) living at an altitude of at least 3,000 m. The orange color represents the Southwestern horses (DeBa, Debao pony from Guangxi; JiCh, Jianchang pony from Sichuan; NiQi, Ningqiang pony from Shannxi). The green represents the Northern horses (MoGo, Mongolian horse from Inner Mongolia; WMG, Mongolian horse from Mongolia; ELC, ErlunChun horse from Heilongjiang; YaQi, Yanqi horse from Xinjiang; Yili horse from Xinjiang). The colors of symbols that indicate the geographic regions are the same as those in the PCA plots and phylogenetic trees. (B) PCA plots of the first two components of all horse samples (inner plot) and all Chinese native horses (outer plot). The fraction of the total variance explained is reported on each individual axis between parentheses. (C) The ML-TreeMix tree of all horses, with PrZ as outgroup, assuming four migration events. Four migration events that are most consistent with known events, because they increased the explained variance to 99.8% (Pickrell and Pritchard 2012), and does not increase afterwards (supplementary table S25, Supplementary Material online). Migration arrows are colored according to their weights. Horizontal branch lengths are proportional to the amount of genetic drift parameter that has occurred on the branch. The drift parameter measures the variance in allele frequency estimated along each branch of the tree. The yellow and orange lines indicate the instantaneous admixtures, whereas arrows denote continuous (unidirectional) gene flow. (D) The Neighbor-Joining tree of the horse breeds, with PrZ as outgroup. Bootstrap reported was close to 100%. (E) ∂a∂i best-supported population model depicting the evolutionary trajectories of the main three clusters of Chinese native horses. The light blue, green, dark blue and orange rectangles represent the ancestral, Northern China (NC), Qinghai-Tibetan (QT) and Southwestern (SW) populations, respectively. The numbers within the rectangles represent the effective size (individual horses) for the corresponding population. The average number of migrants per year between the different groups is shown between the black arrows. Ne = effective size (individuals). T = time of divergence (years).

