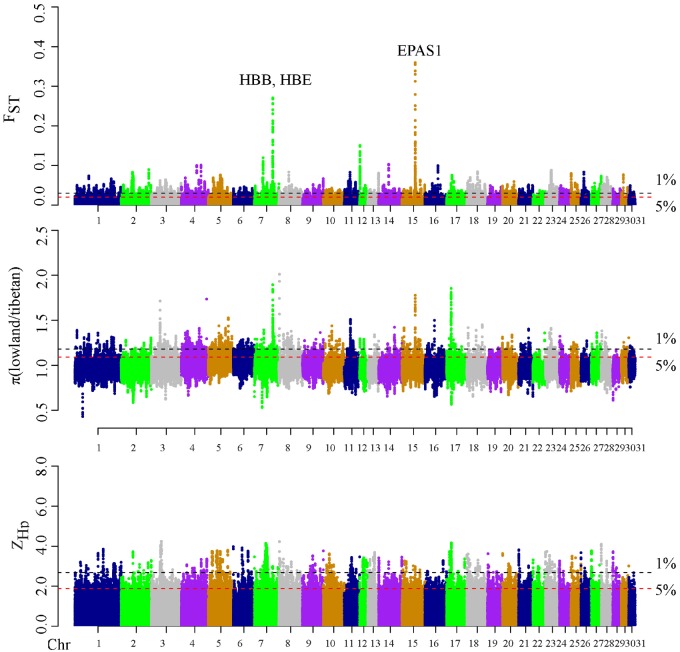
Fig. 2.
Positive selection scans for adaptation to high altitude hypoxia. Horses living at high altitude (QT) are compared with lowland controls (NC and SW). The population genetic differentiation FST values (A), the nucleotide diversity θπ ratios (θπ-LL/θπ-QT) (B) and the transformed heterozygosity score ZHP (C) are calculated within 100 kb sliding windows (step size = 15 kb). The significance threshold of selection signature was arbitrarily set to top 5% percentile outliers for each individual test and is indicated with red horizontal dashed lines. The black horizontal dashed lines display the top 1% quantile.

