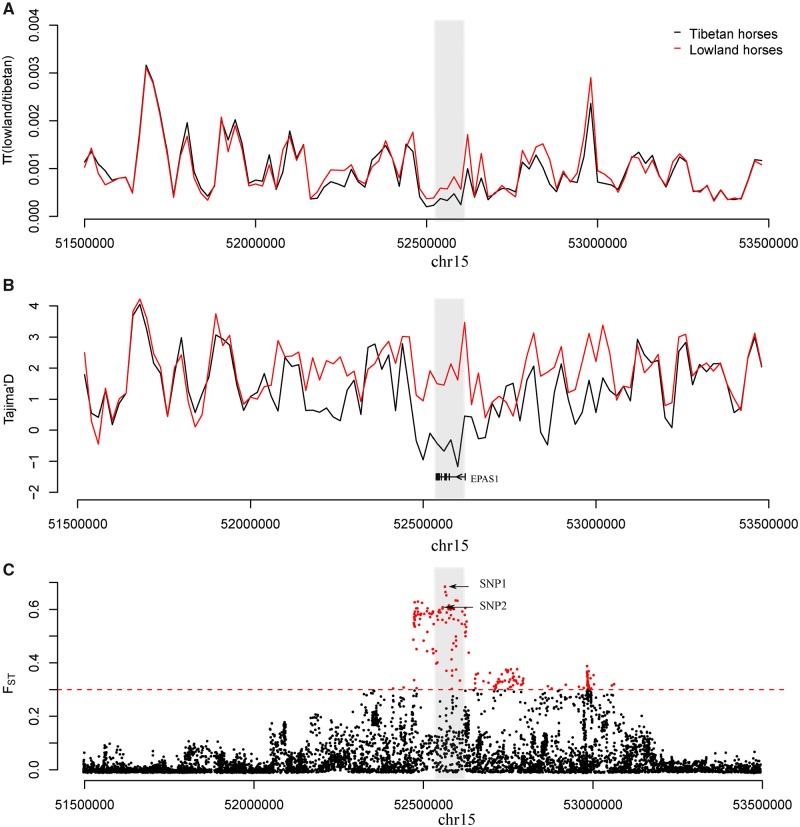
Fig. 3.
The strongest positive selection signatures around the EPAS1 peak. The θπ ratio (θπ-LL/θπ-QT) (A), Tajima’s D (B) and FST value (C) are plotted against the peak position from 51.5 Mb to 53.5 Mb on chromosome 15. Both π ratio and Tajima’s D values were based on a 20 kb window and a 20 kb step. The black and the red lines represent the Tajima’s D values for high-altitude and lowland horses, respectively. The gray columns represent the strongest positive selection signatures in the region considered. The small black boxes and short lines represent the gene structure of EPAS1, which is the only gene within the strongest selective signal. The red dot represents the significant threshold of FST value per SNP > 0.3 and the red dashed line represents the FST threshold. The top two SNPs are noted by black arrows.

