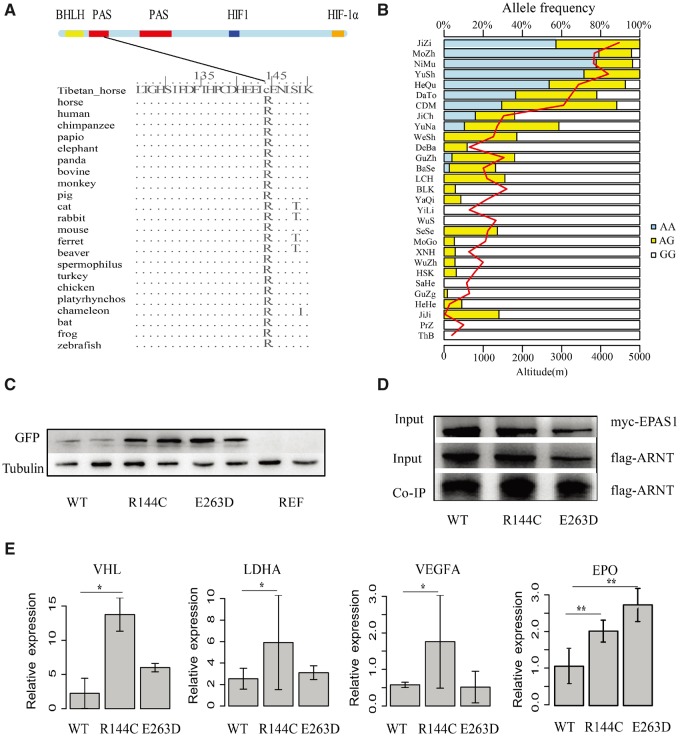
Fig. 4.
Annotation and validation of the EPAS1 missense SNPs showing positive selection signatures. (A) EPAS1 protein sequence analysis. The protein coordinates are based on the ENSECAT00000015683.1Ensembl protein. The upper panel shows the Pfam domains of the EPAS1 protein, including the Per-Arnt-Sim (PAS) domains (red), the basic helix-loop-helix (HLH) domain (yellow), the hypoxia-inducible (HIF) domain (blue) and the C-terminal transactivation (CTAD) domain (orange). Protein sequence polymorphisms present in Tibetan horses and 22 vertebrates are provided. (B) Genotypes were determined using the KASP technology in Przewalski’s horses, Thoroughbred horses and 27 Chinese native horse breeds (N = 908 horses). The region and altitude information are indicated by the red line. (C) Western-blotting analysis of the A549 cell lysates transfected with the GFP-tagged recombinant plasmid of WT, R144C and E263D or the empty vector. WT, R144C and E263D represent the plasmid overexpressing the wild-type EPAS1 protein, SNP1 mutant and SNP2 mutant protein, respectively, REF represents the empty vector. The antiGFP and antiTubulin antibodies were used to measure the protein expression of EPAS1 and the internal reference protein Tubulin, respectively. (D) Validation of EPAS1 and ARNT interactions. A549 cells were cotransfected with myc-tagged EPAS1 and flag-tagged ARNT for 48 h, followed by immunoprecipitation against myc tag and immunoblotting against flag and myc. (E) The qPCR gene expression of the EPAS1 downstream genes, including VEGFA, VHL and LDHA in the transfected A549 cells. EPO expression levels were measured in HepG2 cells. * and ** displayed the statistical significances of P-values < 0.05 and 0.01, respectively.

