
Fig. 2.
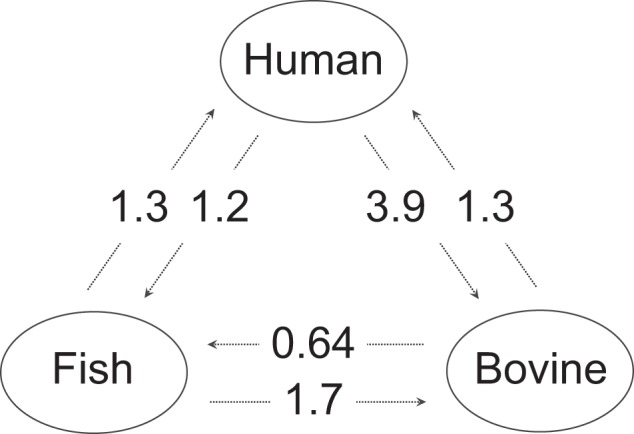
Migrants per generation among human, bovine, and fish hosts. Values shown are medians (averaged over three independent runs). 2.5 and 97.5 percentiles (derived from parameter posterior distributions) were respectively as follows: (human to bovine: 0–8.7), (bovine to human: 0–3.1), (human to fish: 0–3.1), (fish to human: 0–3.1), (bovine to fish: 0–1.7), and (fish to bovine: 0–3.4).