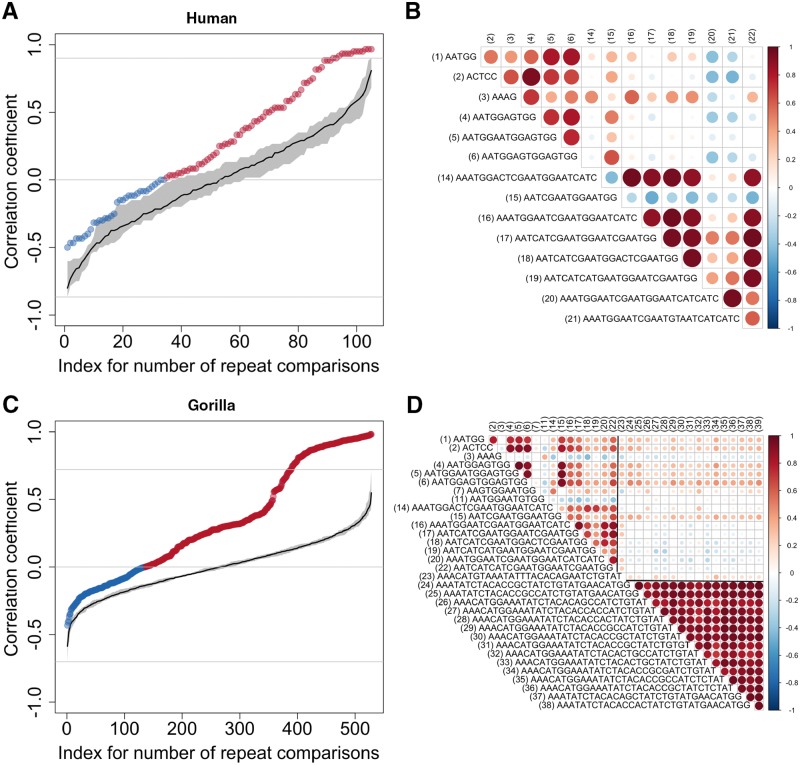
Fig. 5.
Spearman correlations for the densities of the 39 abundant repeats in human and gorilla. Colored dots in the upper (A; Human, n = 105 comparisons) and lower (C; Gorilla, n = 528 comparisons) left panels show observed correlations between pairs of repeats plotted in nondecreasing order, in red when positive and in blue when negative. Chance background correlations, again in nondecreasing order, are plotted in black with variation bands in gray (see Materials and Methods). The heatmaps in the upper (B; Human) and lower (D; Gorilla) right panels show the correlations corresponding to each repeat pair, with various intensities of red (positive) and blue (negative). The size of the circles is also proportional to that of the correlation. Supplementary figure S9, Supplementary Material online, provides the same information for the other species. Only repeats present in the relevant species are shown.

