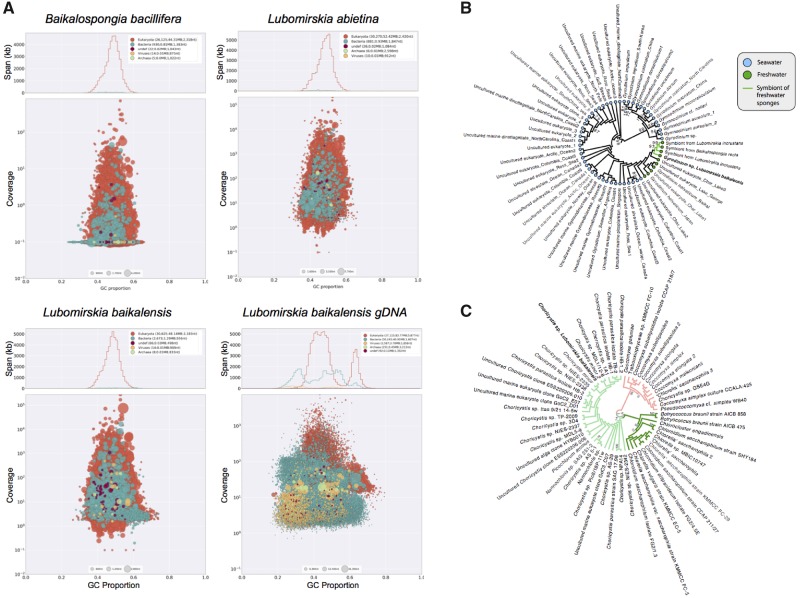
Fig. 2.
(A) Blobplot results, showing distribution of annotated contigs according to GC content (x axis) and coverage (y axis) for the assemblies presented here. Summary statistics are also provided at the top of each panel. Note the bimodal distribution of GC content in the genome, which may represent differences between the coding and noncoding elements of the genome as observed in other species. (B) Maximum likelihood tree showing relationship between Gyrodinium sp. 18S rRNA sequence found in our Lubomirskia baikalensis sample and those identified previously. Note monophyletic group of freshwater samples, and internally to that clade, a monophyletic group of freshwater sponge symbiote sequences, as marked with symbols/colors noted in legend. (C) Maximum likelihood phylogeny showing relationship of Choricystis sp. 28S-ITS1 sequence found in our Lubomirskia baikalensis sample compared with previously sequenced samples from GenBank. Choricystis samples shown at left (light green branches) with our sample shown in bold.

