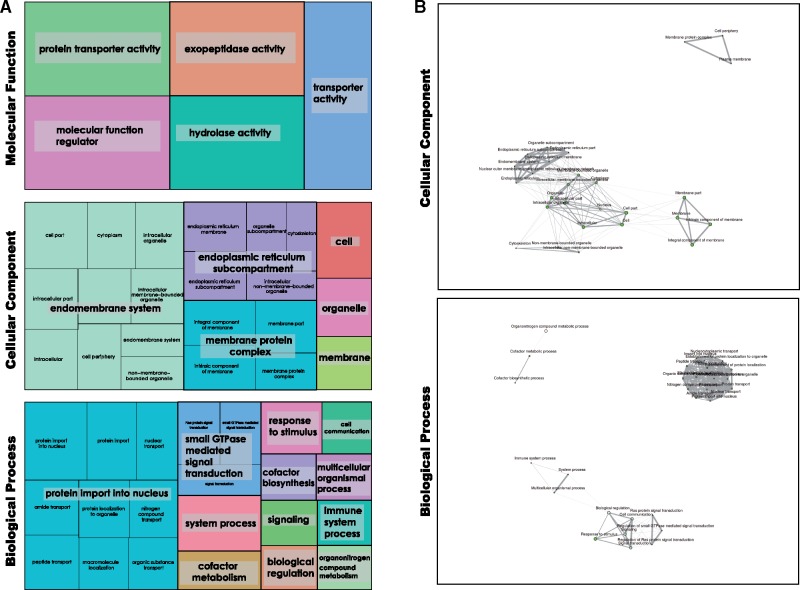
Fig. 5.
(A) GO categories enriched (P value cutoff [FDR] 0.05) in the 61 genes identified as under positive selection by all tests performed, as displayed by REVIGO. These are displayed according to GO subcategory (MF [19 annotated genes], CC [20 genes], and BP [23 genes]), with area of colored squares corresponding to the proportion of GO terms represented. (B) ShinyGO network analysis of enriched GO terms for CC and BP subcategories (P value cutoff false discovery rate (FDR) 0.05) within the 61 genes with consilient evidence for positive selection listed in table 1. Nodes each represent an enriched GO term, with size corresponding to number of genes with this term. Lines connect related GO terms, and line thickness reflects percentage of genes that overlap for these categories. Please note in particular degree of overlap and connectedness of these categories.

