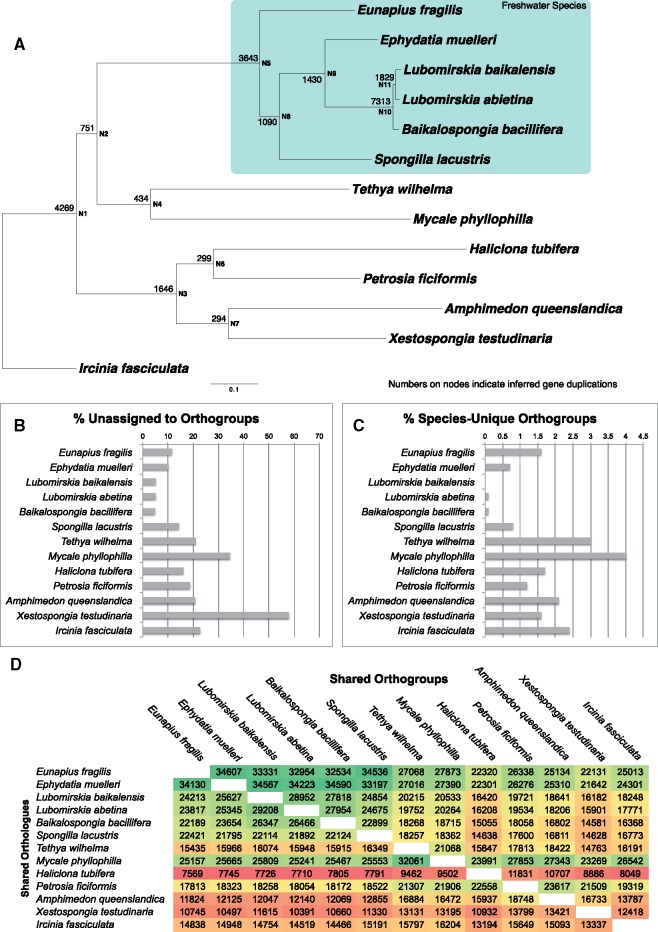
Fig. 6.
Analysis of novelties present in freshwater sponge transcriptomes when compared with a range of other genomes and transcriptomes. (A) Phylogeny of freshwater sponges together with marine outgroups used in this analysis. Tree is rooted with Ircinia fasciculata. Mapped onto the phylogeny at bases of nodes are the number of duplications that were inferred to map to each node. (B) Contigs unassigned to orthogroups (and thus unique, and single copy, within individual species). (C) orthogroups present only in a single species (and thus unique to the species, but with duplication/alternative isoforms present). (D) Matrix of numbers of orthogroups (top) and orthologs (bottom) shared between species, colored as heat map, with green showing the highest number and red the lowest numbers for each comparison. These numbers are given for every species pair and can be read by finding the names of the species for comparison on the x and y labels, and moving to the site of overlap.

