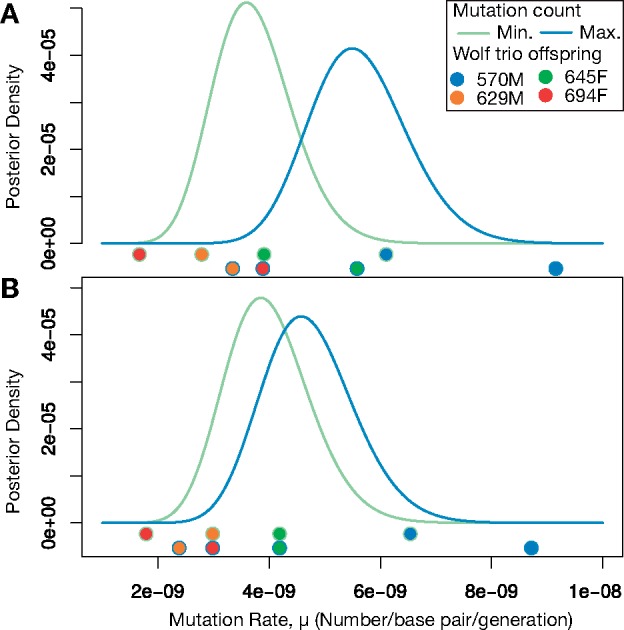
Fig. 5.

Posterior distributions on the mutation rate. (A) Posterior distributions on the per-generation mutation rate without filtering based on GC content. The curve corresponding to the minimum mutation count is the posterior distribution we would calculate if all candidate sites that failed Sanger sequencing are false positives. The curve corresponding to the maximum mutation count is the posterior distribution we would calculate if all failed candidate sites are true DNMs. Dots beneath the curves show the point estimates of the mutation rates that would be obtained from the different trios. (B) Posterior distributions on the per-generation mutation rate after filtering based on GC content.
