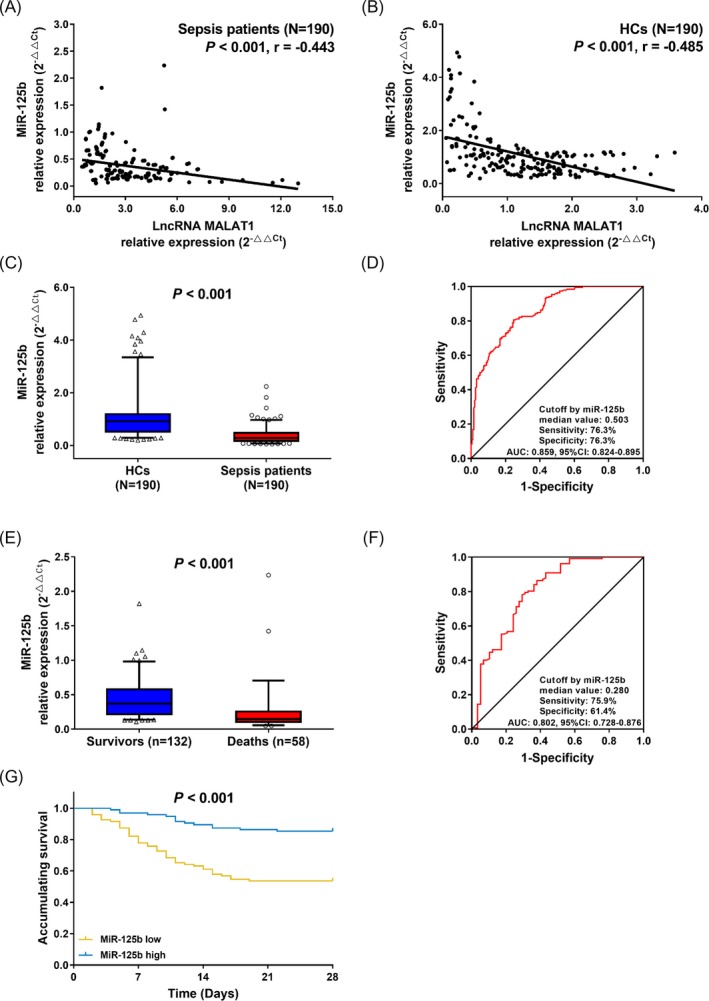
Figure 3.

Correlation of lnRNA MALAT1 expression with miR‐125b. The correlation of plasma lncRNA MALAT1 expression with miR‐125b level in sepsis patients (A) and HCs (B), the expression of miR‐125b in sepsis patients and HCs (C), ROC curve of miR‐125b expression in predicting sepsis risk (D), miR‐125b expression in deaths and survivors (E), ROC curve of miR‐125b expression in predicting 28‐day mortality, (F) and the Kaplan‐Meier curves of patients with high and low miR‐125b expressions (G). Comparisons were determined by Wilcoxon rank sum test. ROC curves were plotted, and AUC with 95% confidence interval was calculated to assess the discrimination ability of miR‐125b for sepsis risk and 28‐day mortality. Kaplan‐Meier curve was used to illustrate accumulating survival, and difference between two groups was determined by log‐rank test. P value < 0.05 was considered significant. MALAT1, metastasis‐associated lung adenocarcinoma transcript 1; HCs, healthy controls; ROC, receiver operating characteristic; AUC, area under the curve
