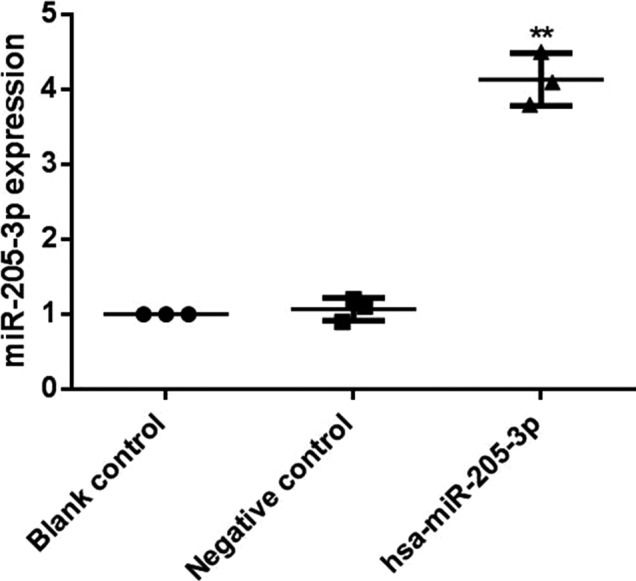
Figure 4.

Detection of miR‐205‐3p expression after transfection by RT‐qPCR. After MCF‐7 cells were transfected with has‐miR‐205‐3p, total RNA was isolated for analysis of the expression of miR‐205‐3p by RT‐qPCR. The miR‐205‐3p expression level in cells in hsa‐miR‐205‐3p group is significantly higher than those in blank control group and negative control group, ** P < 0.01
