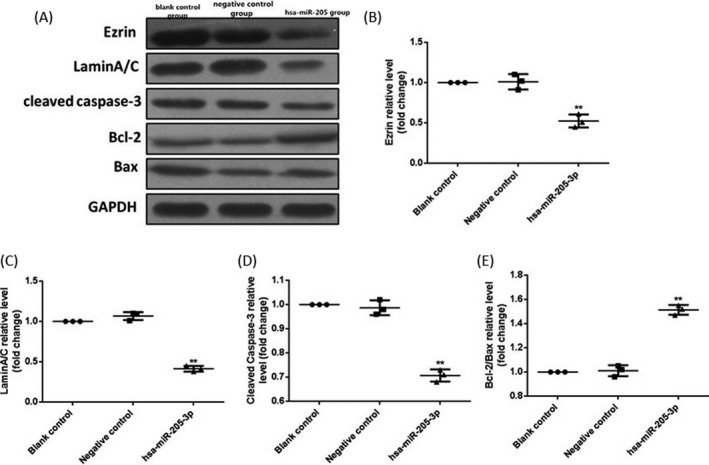
Figure 6.

Detection of related protein expressions in MCF‐7 cells via Western blotting. (A) Protein bands. (B) Statistical graph of Ezrin protein expression level. (C) Statistical graph of LaminA/C protein expression level. (D) Statistical graph of cleaved caspase‐3 protein expression level. (E) Statistical graph of Bcl‐2/Bax protein expression level. Compared with those in the blank control group and negative control group, Ezrin, LaminA/C, and cleaved caspase‐3 expressions are remarkably lower in hsa‐miR‐205‐3p group, but the Bcl‐2/Bax ratio is higher. Data were presented as a fold change relative to GAPDH (mean ± SD). ** P < 0.01
