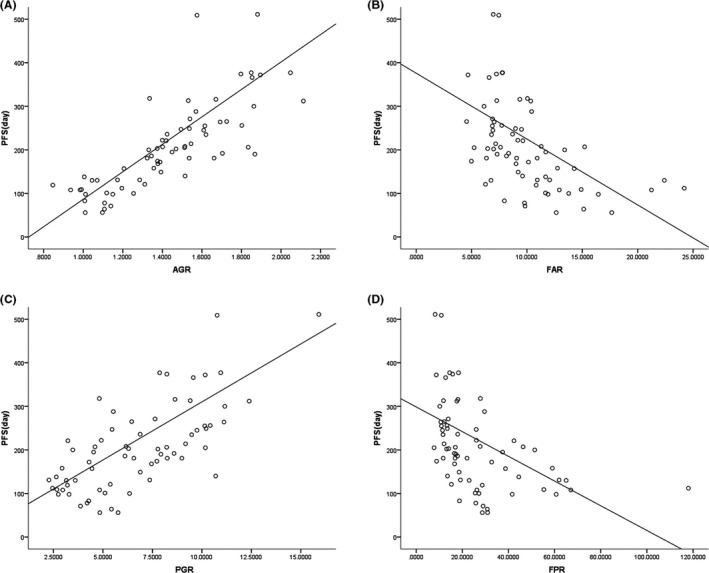
Figure 3.

Pearson's correlation analysis for the linear relationship between the albumin‐to‐globulin ratio (AGR) (A), the fibrinogen‐to‐albumin ratio (FAR) (B), the prealbumin‐to‐globulin ratio (PGR) (C), and the fibrinogen‐to‐prealbumin ratio (FPR) (D), and progression‐free survival (PFS)
