Figure 1.

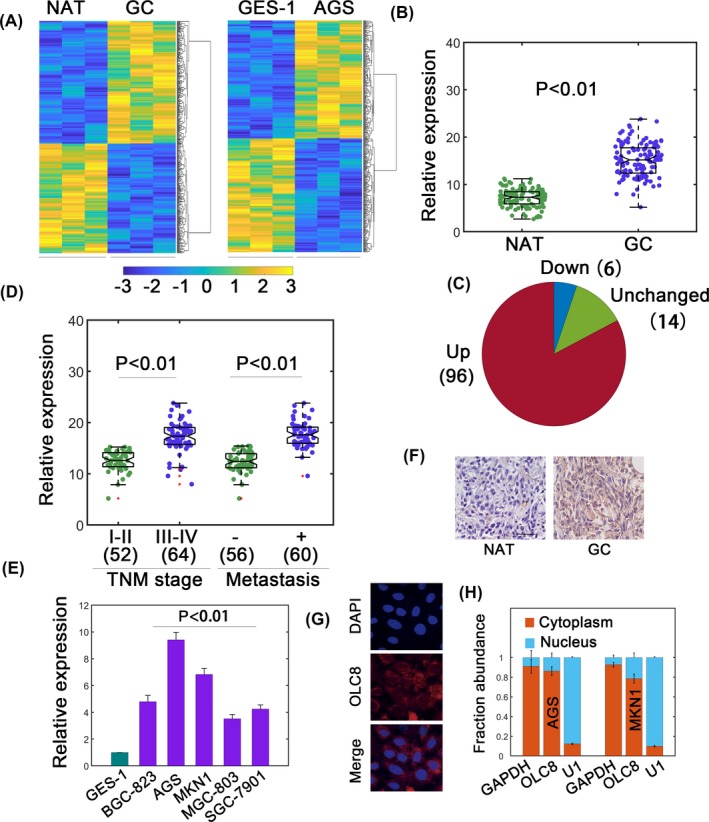
Identification of OLC8 in gastric cancer (GC). (A) lncRNA profiling assays for GC/NAT samples (left) and GES‐1/AGS cells (right). (B) Relative expression (normalized to GAPDH) of OLC8 in GC and NATs. Totally, n = 116. (C) Upregulated, unchanged, and downregulated samples were revealed in pie chart. Data were from (B). (D) Relative expression of OLC8 with respect to TNM stages and metastatic status. The number of cases was shown in brackets. (E) Relative levels of OLC8 in GES‐1 and cancerous cell lines. (F) ISH assay demonstrated high OLC8 expression in GC tissues. (G) The localization of OLC8 was revealed by FISH. (H) Nucleocytoplasmic separation assay to quantify the fraction of OLC8 in cytoplasm or nucleus. **P < 0.01
