
Fig. 3.
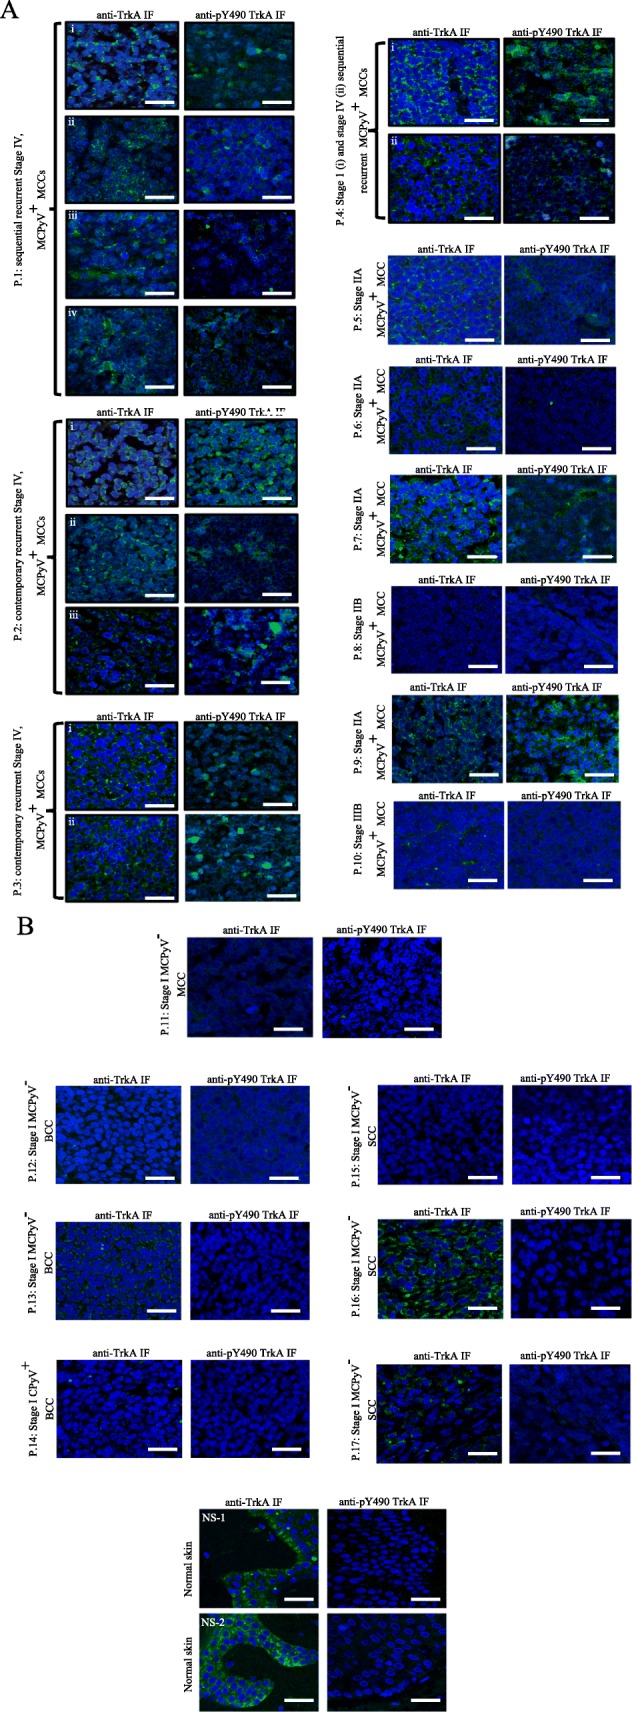
Indirect IF micrographs demonstrating nuclei (blue) and differences in IF immunoreactivity (green) to antibodies against TrkA (anti-TrkA) and Y490 phosphorylated TrkA (anti-pY490 TrkA) in: a) sequential recurrent stage IV MCCs (patients P.1 (i-iv), contemporary recurrent stage IV MCCs (patients P.2 (i-iii) and P4 (i)), and individual stage 1-IV MCPyV large T-antigen positive (MCPyV+) MCCs (patients P.4 (i) and P.5–10) and b) in an MCPyV negative (MCPyV−) MCC (patient P.11), 2 MCPyV negative BCCs (patients, P.12 and P.13), 1 MCPyV large T-antigen positive BCC (patient P.14), 3 MCPyV negative SCCs (patients P.15–17) and 2 MCPyV negative normal skin samples (NS1 and 2) (bar = 50 μm)