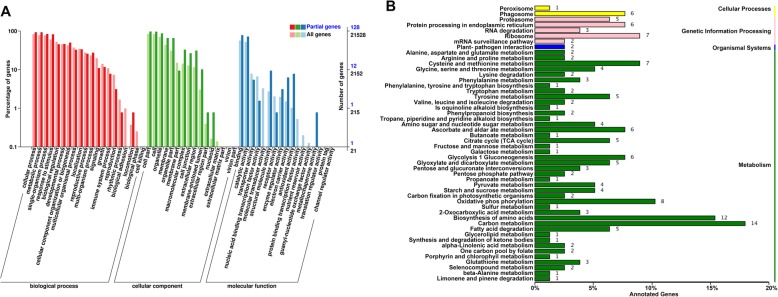
Fig. 4.
GO and KEGG analyses of the quantified proteins. a GO analysis of all the identified proteins under the background of all annotated genes. Y-axis on the right side represents the number of genes. The digital numbers in black represent the number of whole annotated genes, and those in blue are the numbers of the identified proteins. b KEGG enrichment analysis

