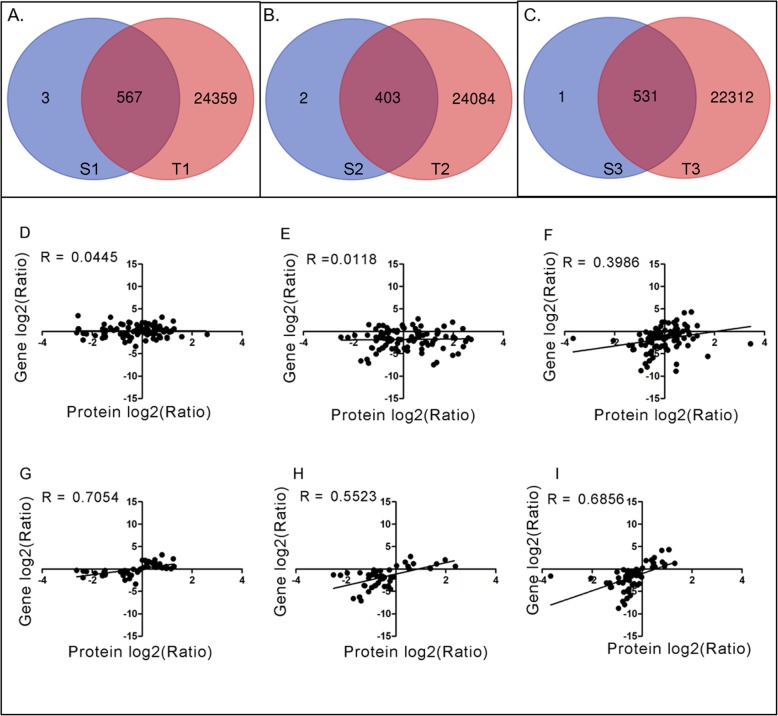
Fig. 6.
Correlation analysis between protein and mRNA data. a, b, and c, shows the comparison of transcriptome and proteome data at stolon stage, middle stage and rhizome stages (T1, T2, and T3 represent data from transcriptome and S1, S2, and S3 represent data from proteome). d-f shows the Pearson correlation coefficients of DEPs in three comparison groups. g-i shows the R value of DEPs with the same trends of expression. d and g represent S1 vs. S2 pair. E and H represent S2 vs. S3 pair. F and I represent S1 vs. S3 pair. R is the correlation coefficient

