
Figure 2.
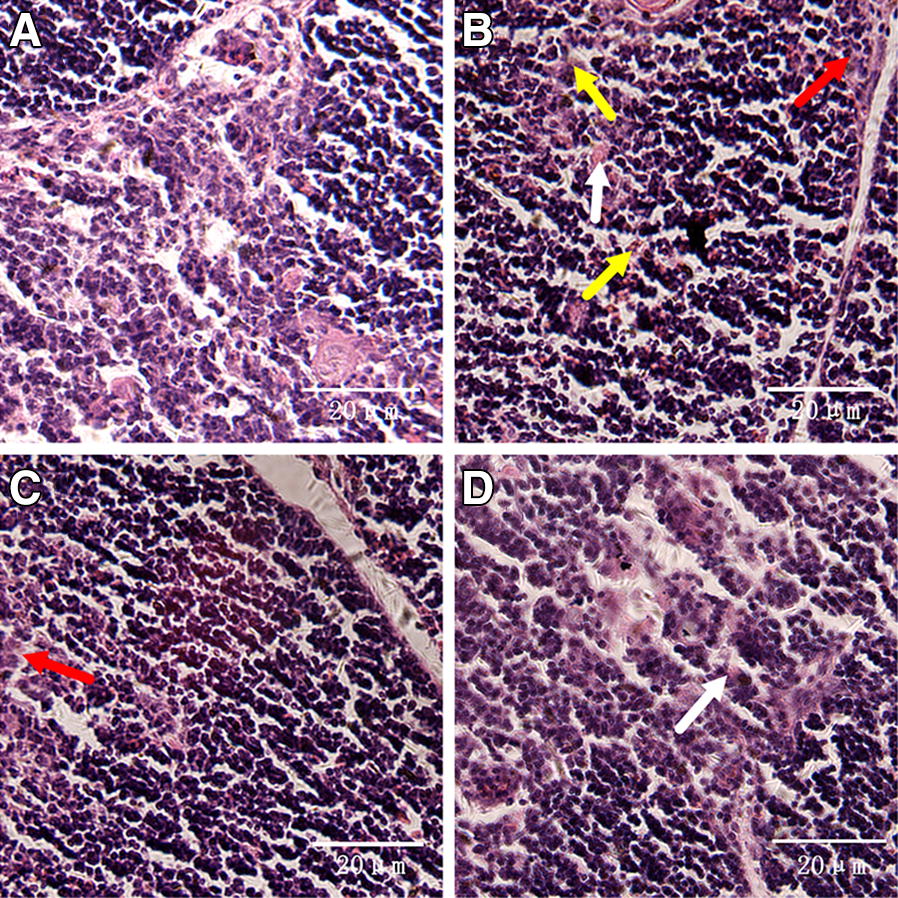
Histopathological analysis of chicken thymus. Histopathological examination of the thymus specimens of four experimental groups is shown in this figure (scale bar = 20 mm). The experimental groups were the A control group, B MG-infected group, C baicalin group (450 mg/kg), and D MG-treated baicalin group (450 mg/kg). The photomicrographs showed obvious reticular cells (red arrows), lymphocyte exudation (white arrows) and cell necrotic debris (yellow arrows).