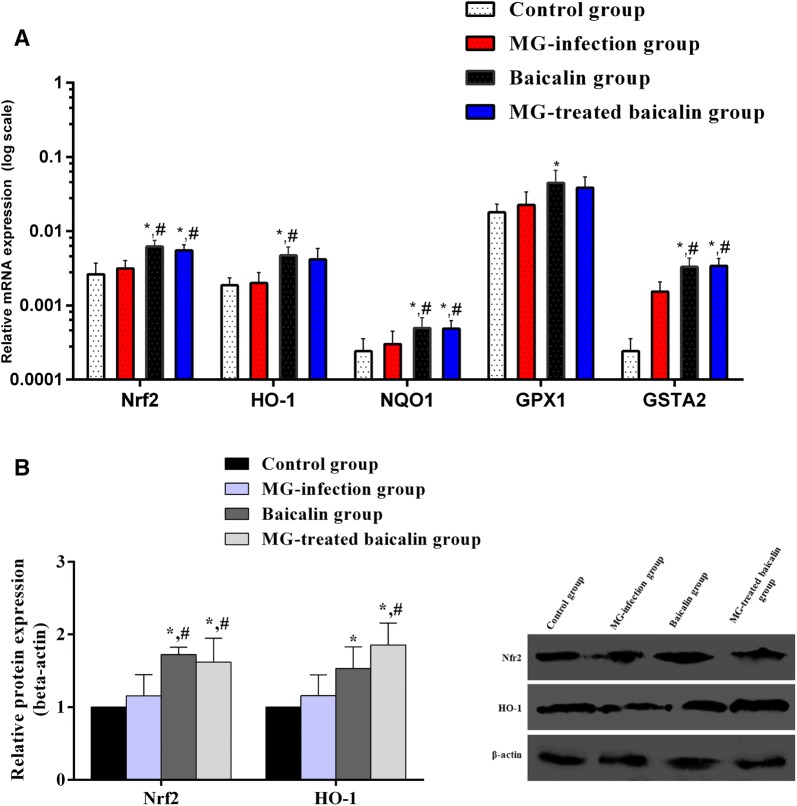
Figure 8.
Effect of baicalin and MG infection on the Nrf2 pathway. This figure shows the effect of the four experimental treatments on the A mRNA expression and B protein expression levels of transcription factor Nrf2 and its downstream genes in chicken thymus tissues. The experimental groups included the control group, MG-infected group, baicalin group (450 mg/kg) and MG-treated baicalin group (450 mg/kg). *p < 0.05 vs. the control group, and #p < 0.05 vs. the MG-infected group. The results are expressed as the mean ± SD (n = 3).

