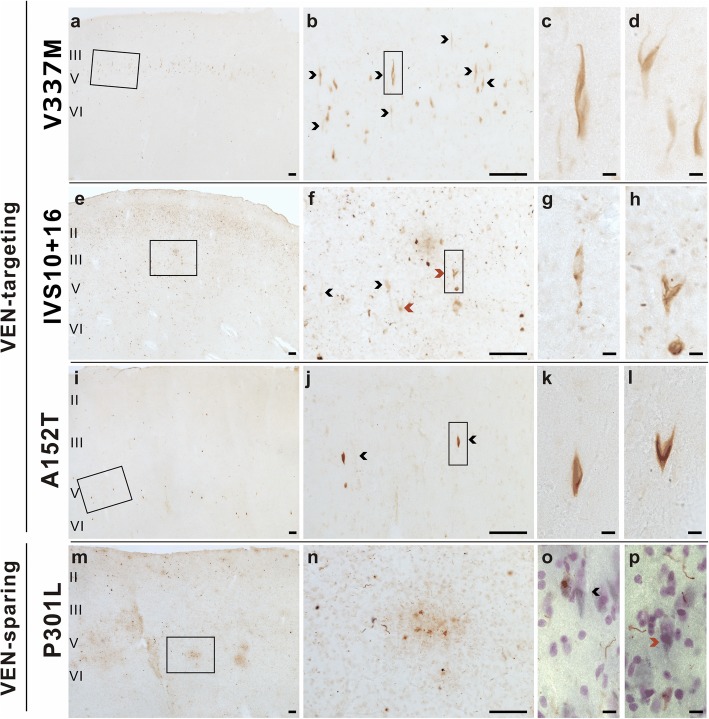
Fig. 3.
VENs (black arrowheads) and fork cells (red arrowheads) showed a high rate of acetylated tau inclusion formation compared to neighboring Layer 5 neurons in patients with V337 M (a-d), IVS10 + 16 (e-h), PSP/A152T (i-l), but not the P301L variant (m-p). Scale bars: a, b, e, f, i, j, m, n = 100 μm; c, d, g, h, k, l, o, p = 10 μm

