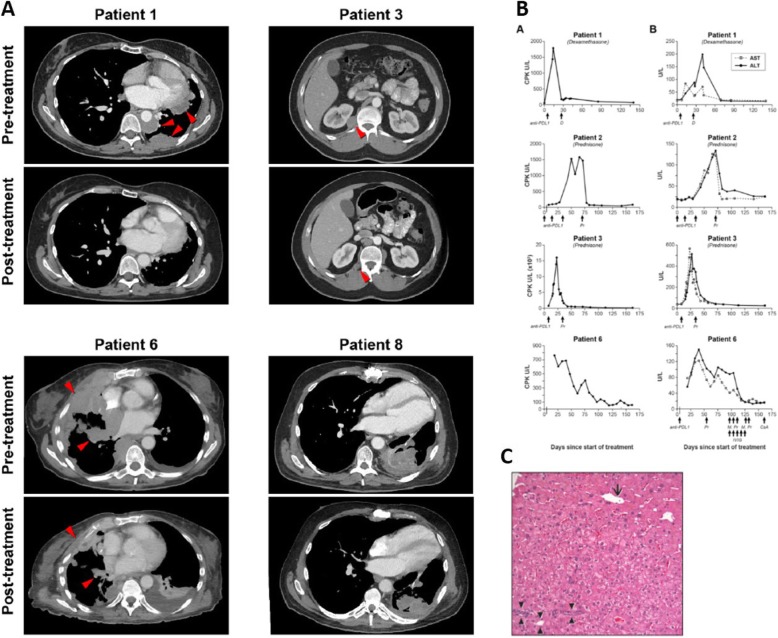
Fig. 2.
Changes in radiographic appearance of tumor and laboratory parameters after treatment. a Changes in selected target lesions in patients responding to treatment. Representative axial CT images of patients achieving a partial response to treatment showing the maximum change in size of selected tumor lesions. b Biochemical changes in response to treatment with avelumab. Column A, on the left, shows changes in CPK. Column B, on the right, shows changes in AST and ALT. Three out of four patients (1, 3, and 6) also developed a radiological response to treatment. In these three cases, only one dose of avelumab could be administered due to the development of autoimmunity. Days of administration of avelumab and other medications are indicated by arrows. c Post-treatment liver core biopsy from patient 1 with portal space (arrowheads), centrilobular vein (arrow) and no evidence of inflammation. CPK: creatinine phosphokinase, AST: aspartate transaminase, ALT: alanine transaminase, D: dexamethasone, Pr: prednisone, M.Pr: methylprednisolone, IVIG: intravenous immunoglobulin, CsA: cyclosporine A

