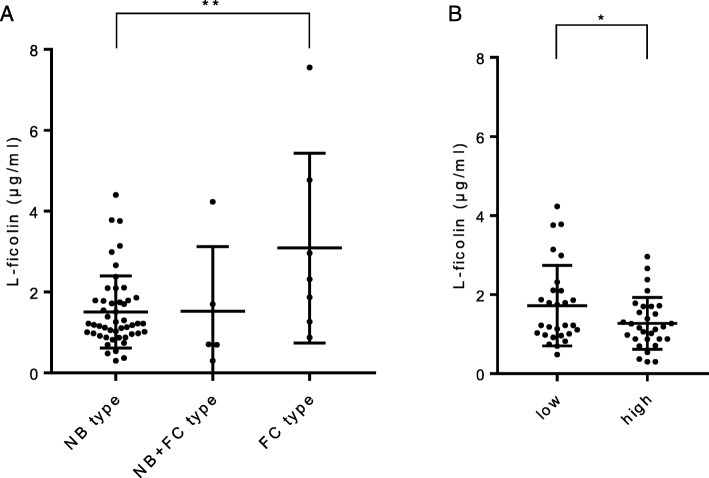
Fig. 2.
a Differences in serum L-ficolin levels by type of MAC disease. NB type, nodular bronchiectatic type; FC type, fibrocavitary type. Lines express the mean ± SD. One-way ANOVA with post-hoc Tukey test, ** p < 0.01. b Differences in serum L-ficolin levels by severity of MAC disease. MAC patients were separated into two groups by HRCT scoring. The HRCT low-score group was ≤6 and the high-score group was ≥7. Lines express the mean ± SD. Student’s t-test, * p < 0.05

