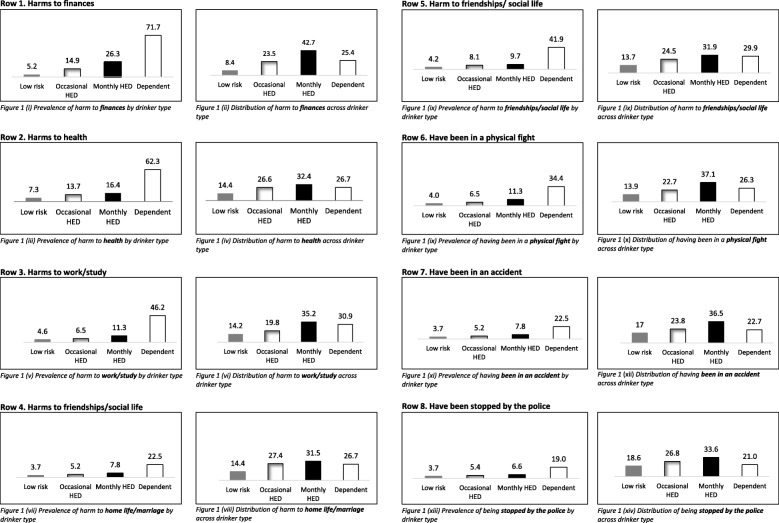
Fig. 1.
displays the prevalence and distribution of alcohol-related harms across each of the four types of drinker in the study. The figures on the left hand side illustrate the percentage of each drinker type that experienced each of the alcohol-related harms in the last 12 months. The figures on the right-hand side depict the overall proportion of each of the harms that were accounted for by each type of drinker

