Fig. 2.

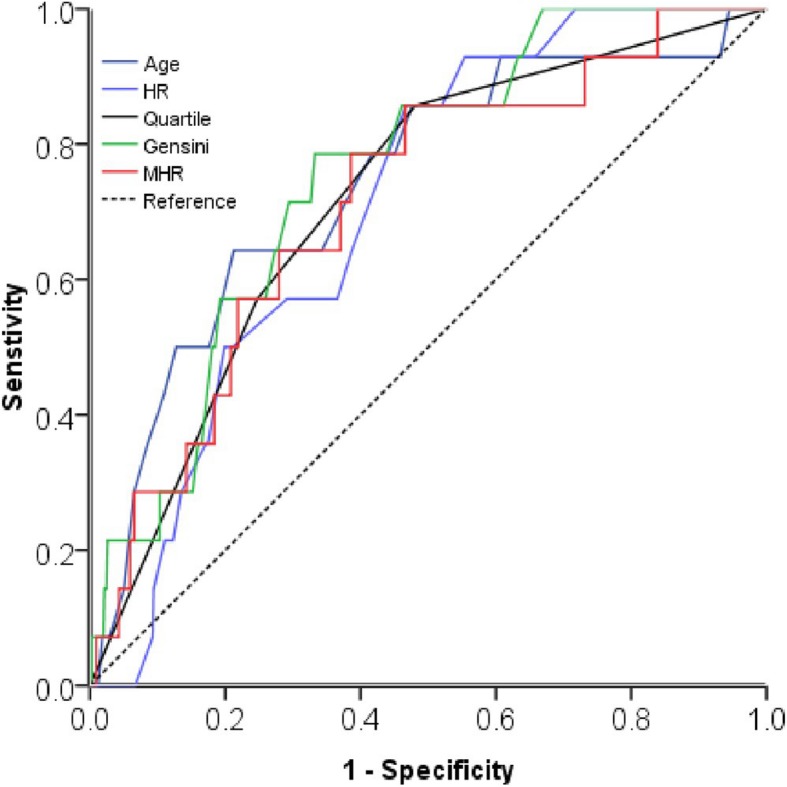
Receiver operating curve (ROC) for the analysis of possible predictors of all-cause mortality in the study population. AUC indicates area under curve

Receiver operating curve (ROC) for the analysis of possible predictors of all-cause mortality in the study population. AUC indicates area under curve