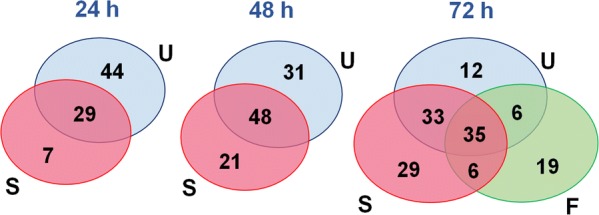
Fig. 1.

Active Pathogen Box compounds identified by the three institutions. Venn diagram indicating the number of unique or shared actives identified by the three assays. Comparisons across all three groups were only possible at the 72-h time point when the XTT assay (FIOCRUZ) was completed and the data analyzed. U (blue), S (magenta) and F (green) represent UCSD, Swiss TPH and FIOCRUZ, respectively
