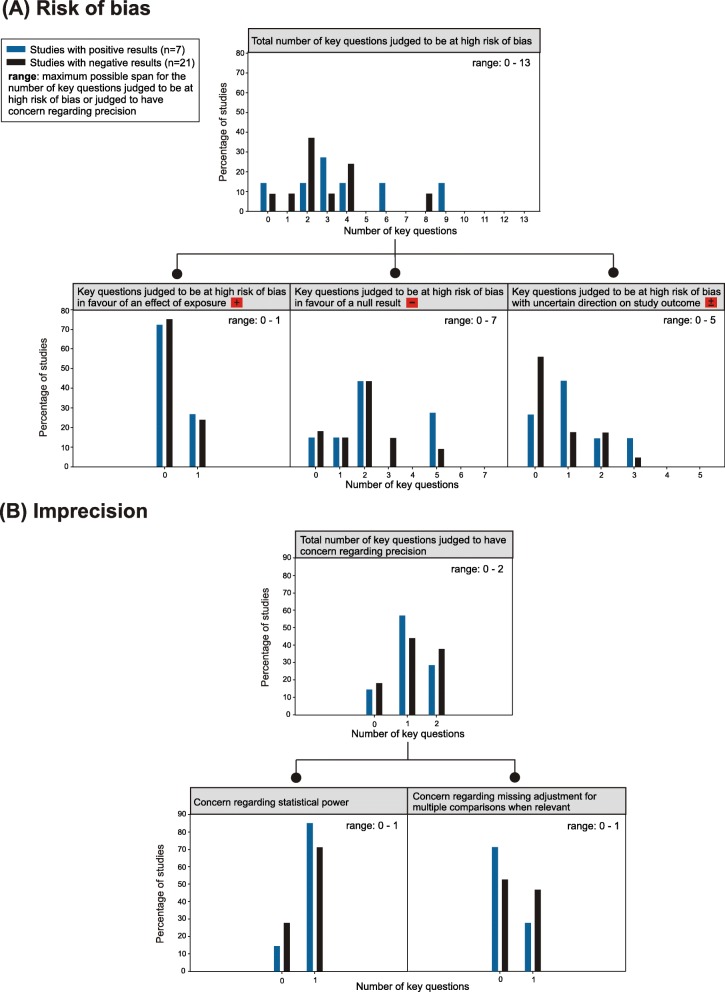
Fig. 3.
Comparison of the profiles of limitations between studies with positive and negative results. The distributions are depicted in percentages and are sorted by study outcome. a Distributions for judgements about risk of bias. Upper figure: total number of key questions; lower figures: numbers of key questions according to direction of bias. See Table 1 for specification which key questions are grouped under the various directions of bias. b Distributions for judgements about imprecision. Upper figure: total number of key questions; lower figures: left – concern regarding statistical power, right – concern regarding missing adjustment for multiple comparisons

