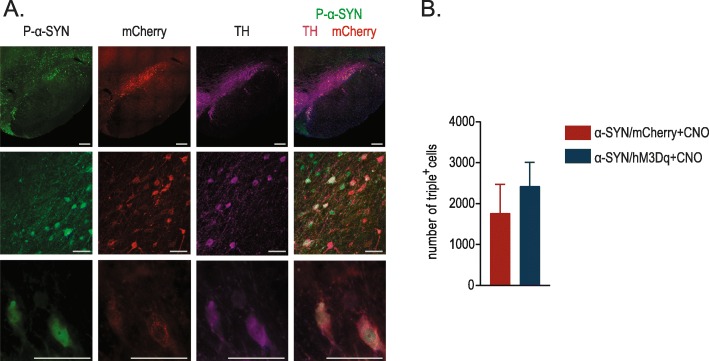
Fig. 3.
Stereological quantifications of the number of P-S129 α-SYN, mCherry and TH+ cells. a Confocal images of triple immunofluorescent staining for P-S129 α-SYN (green), mCherry (red) and TH (purple) in the injected SN at different magnifications (Scale bars = 250 μm upper panel and 50 μm lower and middle panel). b Quantifications of P-S129 α-SYN/TH/mCherry triple positive cells. (n = 5–6, Mean ± SD, Unpaired T-test)

