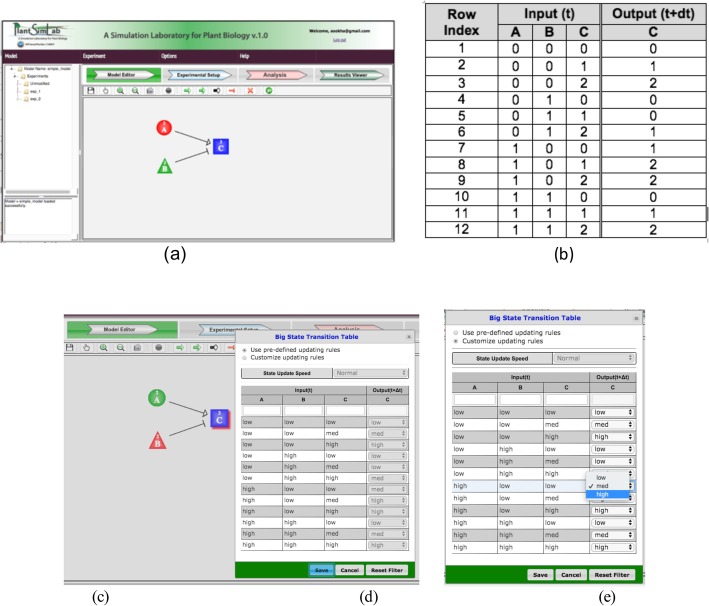
Fig. 1.
The wiring diagram of a simple network model containing three nodes (a). A table to show the calculation of all possible state transitions for a target node C in the network model (b). Double clicking on a node on the Model Editor canvas highlights the node in the back and opens up the Big State Transition Table (BSTT) for the node (c). The user can use the predetermined choice (d), or change it by selecting a desired state from the dropdown box in the row (e)

