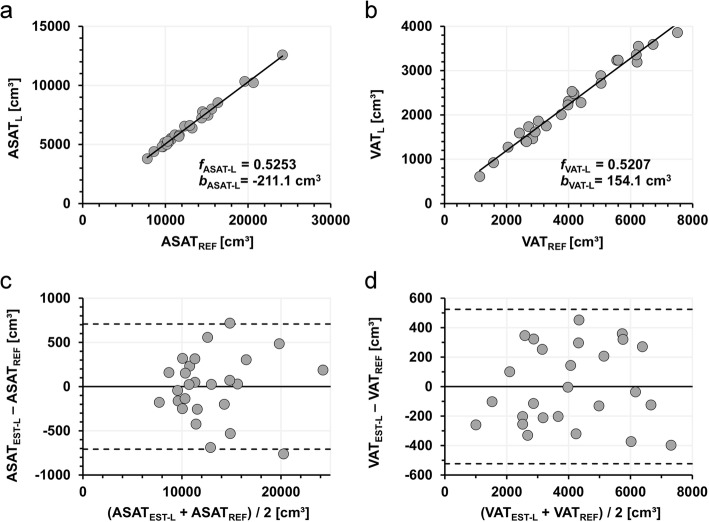
Fig. 2.
Correlation of half-body and full-body ASAT and VAT measurements. Linear fits through the data (a and b) are represented by solid lines. Coefficients of determination were R2 = 0.99 for ASAT (a) and R2 = 0.98 for VAT (b). Corresponding Bland-Altman plots for ASAT (c) and VAT (d) reveal good agreement between both methods

