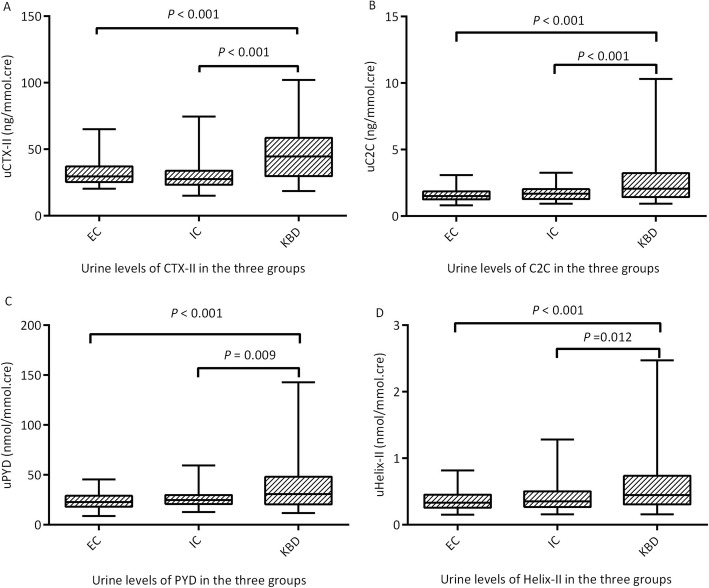
Fig. 1.
The levels of uCTX-II (a), uC2C (b), uPYD (c), and uHelix-II (d) in the EC group, the IC group, and the KBD group. The medians of the four biomarkers in the KBD group were significantly higher than those in the IC group (H = −6.512, P < 0.001; H = −3.813, P < 0.001; H = −2.973, P = 0.009; and H = −2.871, P = 0.012, respectively) and in the EC group (H = − 4.942, P < 0.001; H = − 4.837, P < 0.001; H = − 4.628, P < 0.001; and H = − 4.054, P < 0.001, respectively). There were no differences between the IC group and EC group (H = 1.490, P = 0.409; H = − 1.045, P = 0.889; H = − 1.659, P = 0.291; and H = − 1.194, P = 0.698, respectively)

