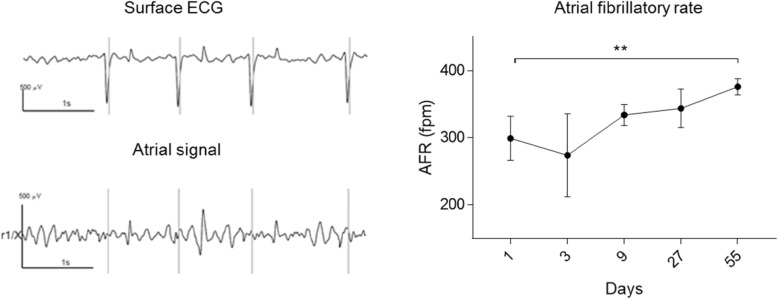
Fig. 4.
Atrial fibrillatory rate. Left: Example of spatiotemporal QRST cancellation: From the surface ECG (top trace), the software identifies the QRS complexes. After QRST cancellation, only the atrial signal remains (bottom trace). Right: The course of AFR during the study. AFR increases significantly (p < 0.01) from day 1 to day 55 consistent with atrial remodeling. n = 6 except day 3 (n = 2). Data are presented as mean ± SD. AFR = atrial fibrillatory rate, fpm = fibrillations per minutes. Asterisks indicate statistical significance (p < 0.01)

