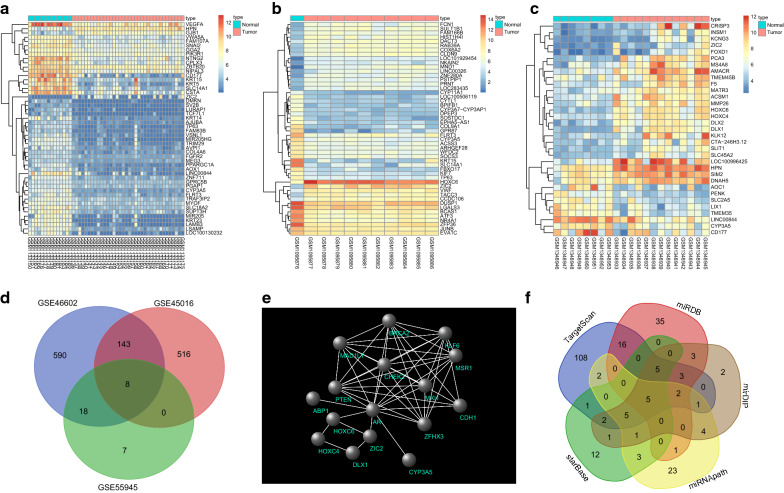
Fig. 1.
miR-129-5p influences PCa by regulating ZIC2 via the Wnt/β-catenin signaling pathway. a–c The heat maps depicting DEGs in PCa-related microarray datasets, with the X label indicating the sample number, the Y label indicating the gene name; the left-side dendrogram indicating gene expression clustering, with each small square in the figure representing the expression of one gene in one sample, and the histogram in the upper right representing the color gradation; d venn diagram analysis for DEGs in PCa-related microarray datasets, the 3 circles with different colors in the figure respectively represent the number of DEGs in the 3 PCa microarray datasets, the overlapping area indicates the intersection among the three microarray datasets; e gene interaction network map, each small ball in the figure denotes one gene, and the line between two small balls indicates an interaction; f predicted miRNAs that regulate ZIC2, and results from five databases are included. Five colors represent the prediction outcomes of five databases, the overlapping area indicates the intersecting results. PCa prostate cancer, ZIC2 zinc-finger protein of the cerebellum 2, DEGs differentially expressed genes

