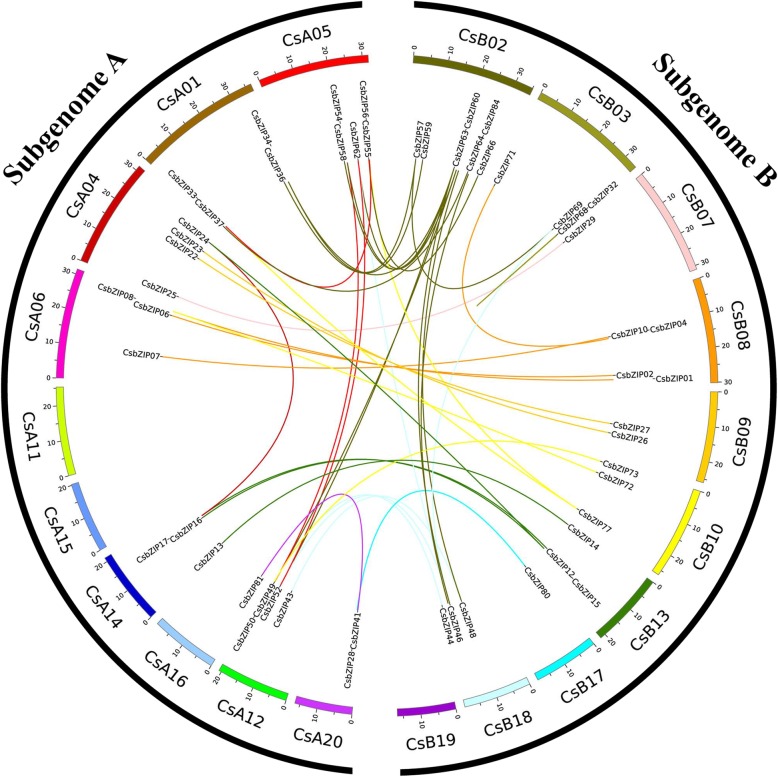
Fig. 2.
Distribution and synteny analysis of C. songorica bZIP genes. In the figure, the 20 C. songorica chromosomes are shown in different coloured partial circles, and chromosome numbers are indicated at the top of each bar. Coloured bars indicate bZIP syntenic regions in the C. songorica bZIP gene family

