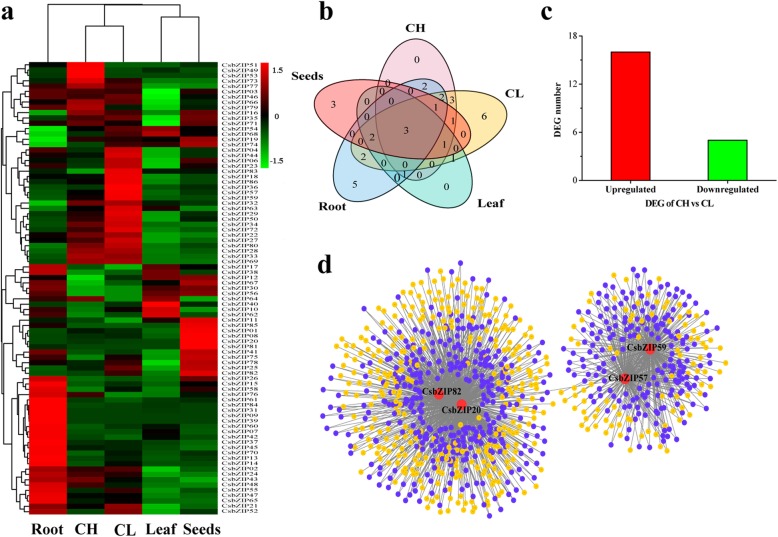
Fig. 7.
Expression and co-expression network analysis of the CsbZIP genes in CH and CL flowers. a Heat map of all CsbZIP genes in different tissues based on transcriptome datasets. The expression values (FPKM) were normalized. b Venn diagram showing overlap of highly expressed CsbZIP genes (FPKM ≥20) in different tissues. c Number of differentially expressed CsbZIP genes between CH and CL flowers. d Co-expression network of CsbZIP genes with DEGs between CH and CL flowers. The grey lines between two nodes indicate co-expression relationships. The purple solid circles represent overlapping genes

