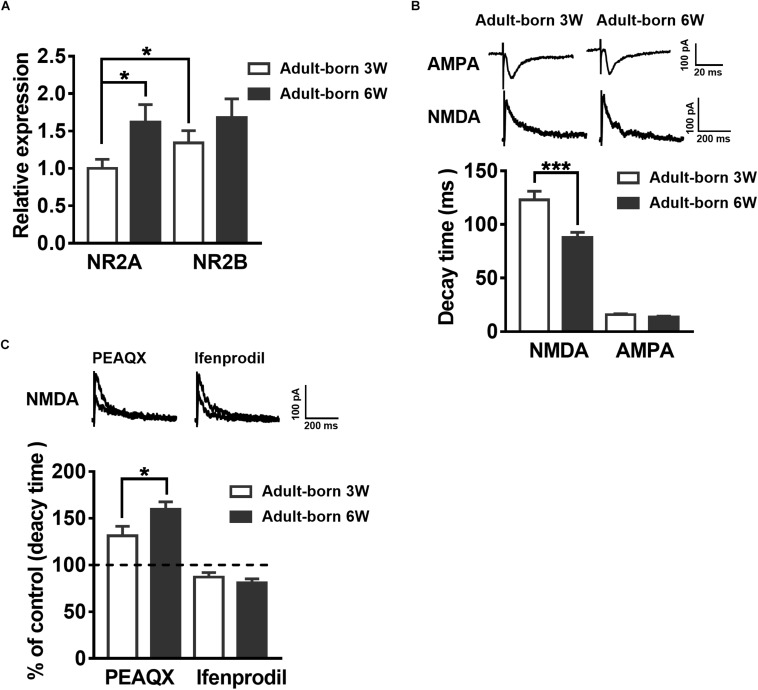
FIGURE 3.
Developmental alterations in NMDAR subunit composition in adult mouse newborn DGCs. (A) NR2AR and NR2BR mRNA relative expression in newborn 3-week-old and 6-week-old DGCs of adult mice. Values represent the mean ± SEM (∗p < 0.05; t-test). (B) The AMPA- and NMDA-mediated EPSCs recorded under whole-cell voltage-clamp (Vm = –70 mV for AMPA-EPSCs, Vm = + 40 mV for NMDA-EPSCs) from adult-born 3-week-old and adult-born 6-week-old DGCs. CNQX (10 μM) and PTX (50 μM) were delivered in the perfused ACSF solution throughout NMDA-EPSC recordings. Shown in the upper row are representative example traces of AMPA- and NMDA-EPSCs recorded under the whole-cell voltage-clamp. The lower row shows the statistical analysis of the AMPA- and NMDA-EPSC decay time in adult-born 3-week-old (white bar) and adult-born 6-week-old (black bar) DGCs. Bottom row, the summary data demonstrate that the decay time of NMDA-EPSCs becomes slower in adult-born 3-week-old than in adult-born 6-week-old DGCs, whereas the decay time of AMPA-EPSCs does not obviously change during the development of adult newborn DGCs. Values represent the mean ± SEM (∗∗∗p < 0.001; unpaired t-test). (C) Shown in the top row are typical sample traces of NMDA-EPSCs recorded under whole-cell voltage-clamp before and after perfusion with PEAQX or ifenprodil in adult mouse newborn 3-week-old DGCs. Bottom row, quantification of the decay time of NMDA-EPSCs in newborn 3-week-old and newborn 6-week-old DGCs after PEAQX and ifenprodil administration. Values represent the mean ± SEM (∗p < 0.05; unpaired t-test).

