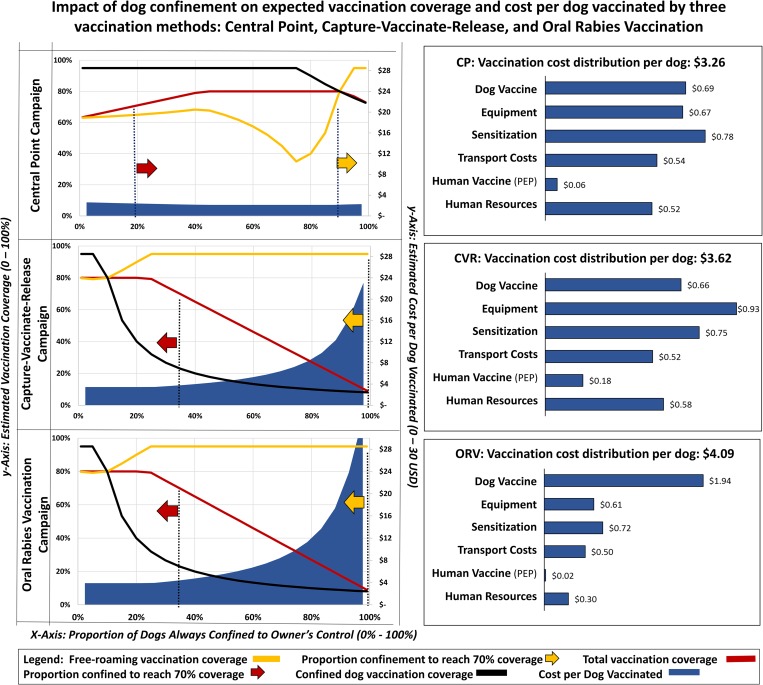
Fig. 3.
Sensitivity analysis showing the impact of dog confinement on expected vaccination coverage and cost-per-dog-vaccinated by three vaccination strategies.
All three scenarios assumed GDREP phase III vaccination strategy effectiveness levels (Box 1). Each scenario assumed a population of 30 000 dogs and a campaign for which 24 000 vaccine doses were procured and distributed as follows: Central Point: 90% CP, 5% DD, 5% CVR // Capture-Vaccinate-Release: 5% CP, 5% DD, 90% CVR // Oral Rabies Vaccination: 5% CP, 5% DD, 5% CVR, 85% ORV. Summary costs for each scenario are provided in the right column; cost summary results assumed a fixed confinement population distribution of 28% confined, 48% semi-confined and 24% never confined. Average cost horizontal bars reflect the intra-method relational distribution of costs. Confinement proportions were obtained by the formulas: semi-confined = 1 – (confined × 0.66) and never confined = 1 – (confined × 0.33). Red arrows indicate the scenarios in which >70% total dog vaccination coverage is expected to be achieved. Yellow arrows indicate scenarios in which >70% free-roaming dog vaccination coverage is expected to be achieved.

