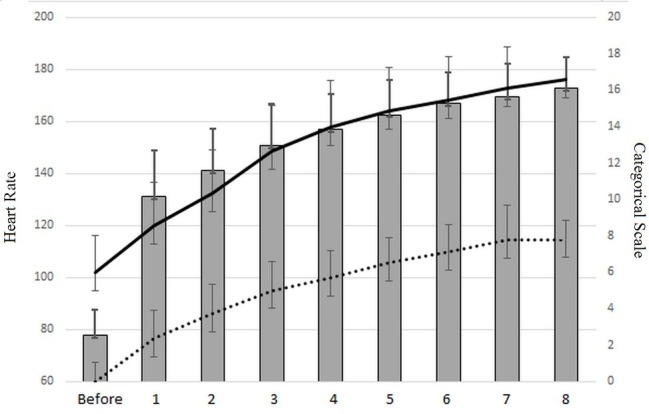
Figure 4.

Heart rate evolution (gray histogram), rating values of perceived exhaustion (black curve), and categorical rating score (dotted line).

Heart rate evolution (gray histogram), rating values of perceived exhaustion (black curve), and categorical rating score (dotted line).