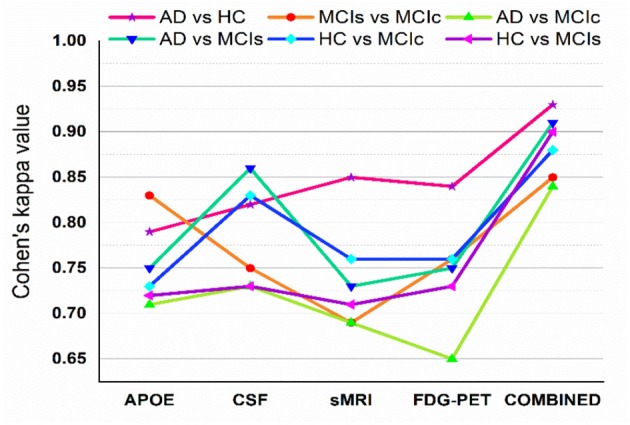
Figure 5.

Cohen's kappa score for AD vs. HC, MCIs vs. MCIc, AD vs. MCIc, AD vs. MCIs, HC vs. MCIs, and HC vs. MCIc (each experiment obtained kappa value is shown by different solid color lines). This Cohen's kappa plot shows that combined features outperform the single modality features in all experiments.
