Figure 1.

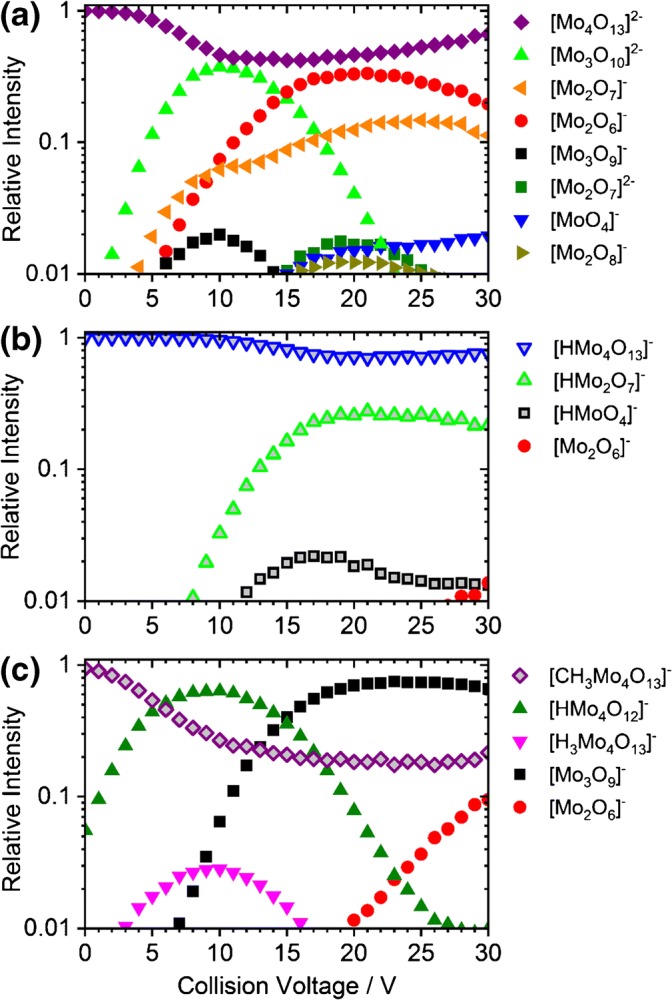
CID breakdown curves of the [Mo4O13]2− (a), [HMo4O13]− (b), and [CH3Mo4O13]− (c) clusters. Only ions with relative intensities higher than 1% are shown. See Figure S2 for breakdown curves including all fragment ions down to the noise level

CID breakdown curves of the [Mo4O13]2− (a), [HMo4O13]− (b), and [CH3Mo4O13]− (c) clusters. Only ions with relative intensities higher than 1% are shown. See Figure S2 for breakdown curves including all fragment ions down to the noise level