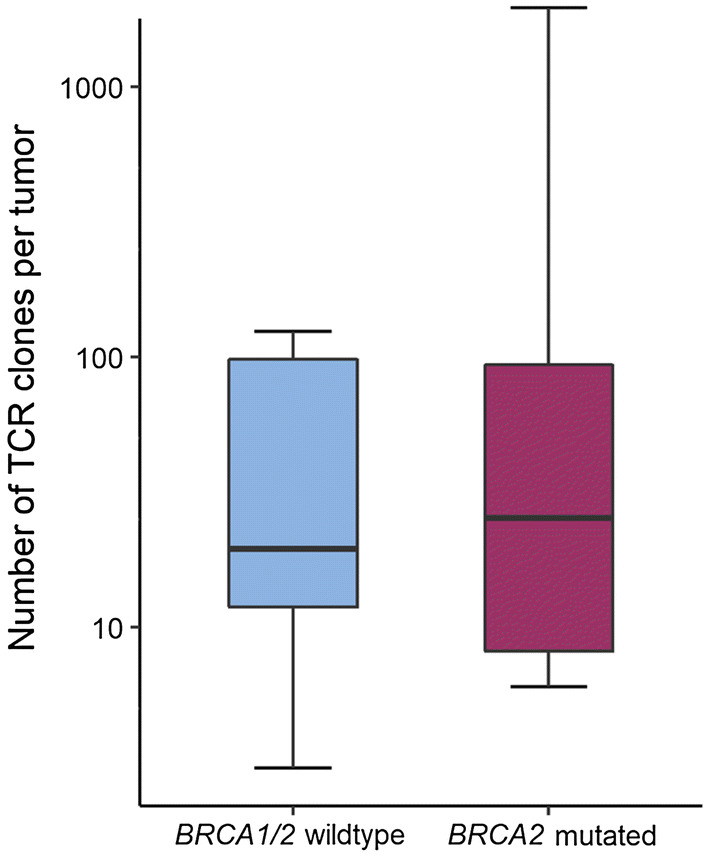
Fig. 1.

Number of TCR clones per tumor by BRCA1/2 mutation status. Box plots represent the median number of identified TCR clones per sample in BRCA1/2 wild-type (blue) and BRCA2-mutated (red) prostate cancer identified by TCR sequencing. Whiskers representing minimum and maximum of each group. A log10 scale is used for the y-axis
