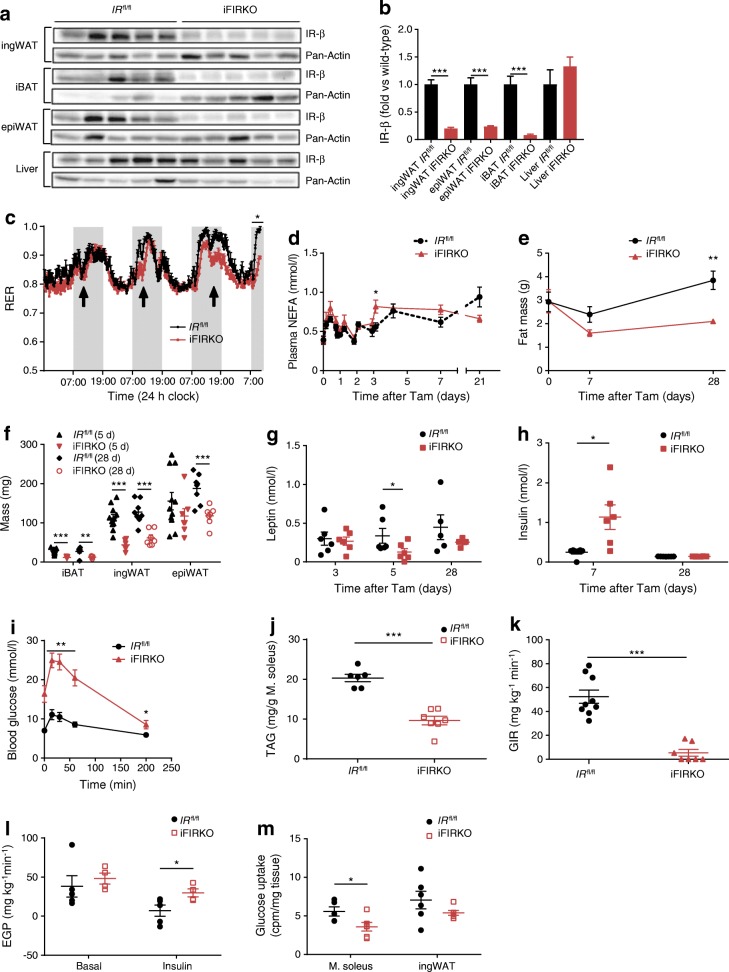
Fig. 1.
Inducible fat-specific IR knockout first reduces RER then leads to hyperinsulinaemia that correlates with hypoleptinaemia and insulin resistance, before it reduces the mass of all adipose tissue depots. (a) Western blot of IR-β and Pan-Actin in adipose tissue and liver lysates (n = 5 for IRfl/fl and iFIRKO). (b) Quantification of western blot band intensity of IR-β normalised to Pan-Actin and expressed as fold vs wild-type (IRfl/fl) in adipose tissue and liver lysates (n = 5 for IRfl/fl and iFIRKO). (c) Time course of RER (/) during induction of IR knockout by tamoxifen (arrows indicate tamoxifen gavage) (n = 5 for IRfl/fl; n = 6 for iFIRKO). (d) Time course of NEFA concentration in mice fed ad libitum (n = 6–13 for IRfl/fl; n = 6 for iFIRKO). (e) Total fat mass measured by EchoMRI 0, 7 and 28 days after tamoxifen (n = 8 for IRfl/fl; n = 6 for iFIRKO). (f) iBAT, ingWAT and epiWAT wet weight 5 days (5 d) or 28 days (28 d) after tamoxifen (n = 11 for IRfl/fl (5 d); n = 6 for iFIRKO (5 d); n = 8 for IRfl/fl (28 d); n = 7 for iFIRKO (28 d)). (g) Plasma leptin concentration measured with ELISA 3, 5 and 28 days after tamoxifen (n = 5–6 for IRfl/fl; n = 5–7 for iFIRKO). (h) Plasma insulin concentration measured by ELISA 7 and 28 days after tamoxifen (n = 6–7 for IRfl/fl; n = 6–8 for iFIRKO). (i) IPGTT in 4 h-fasted iFIRKO and IRfl/fl control mice, 7 days after tamoxifen administration (n = 8 for IRfl/fl; n = 6 for iFIRKO). (j) Amount of triacylglycerol in soleus muscle, 2 weeks after tamoxifen administration (n = 6 for IRfl/fl; n = 7 for iFIRKO). (k) Glucose infusion rate during steady state of hyperinsulinaemic–euglycaemic glucose clamping in iFIRKO and IRfl/fl littermate controls (n = 9 for IRfl/fl; n = 7 for iFIRKO). (l) Endogenous glucose production rate under basal and insulin-stimulated conditions (n = 5 for IRfl/fl; n = 4 for iFIRKO). (m) Uptake of 14C-glucose per mg tissue into soleus muscle and ingWAT (n = 5–6 for IRfl/fl; n = 6 for iFIRKO). In (k–m) hyperinsulinaemic–euglycaemic clamps were performed 7 days after tamoxifen administration. Data are mean ± SEM. Student’s t test: *p < 0.05, **p < 0.01, ***p < 0.001 for iFIRKO vs IRfl/fl or as shown. In (i) difference is significant for all time points below the line. d, days; EGP, endogenous glucose production rate; GIR, glucose infusion rate; M. soleus, soleus muscle; TAG, triacylglycerol; Tam, tamoxifen

