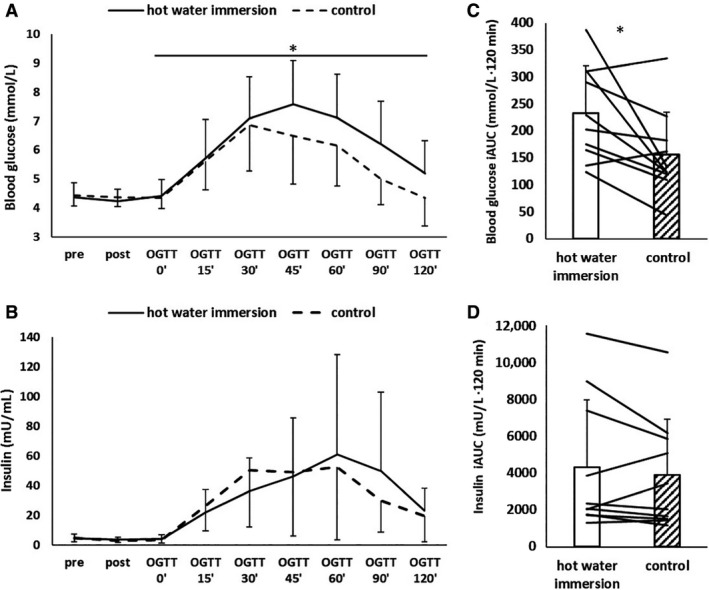
Figure 1.

Blood glucose and plasma insulin concentrations in response to an oral glucose tolerance test (OGTT) after hot water immersion or control. (A and B) time course (means and standard deviations); (C and D) Incremental area under the curve (iAUC) for the whole duration of the OGTT for glucose and insulin (bars and whiskers: means and standard deviations, lines: individual responses). Main effect of time observed for both glucose and insulin; *difference between conditions, at P < 0.05.
