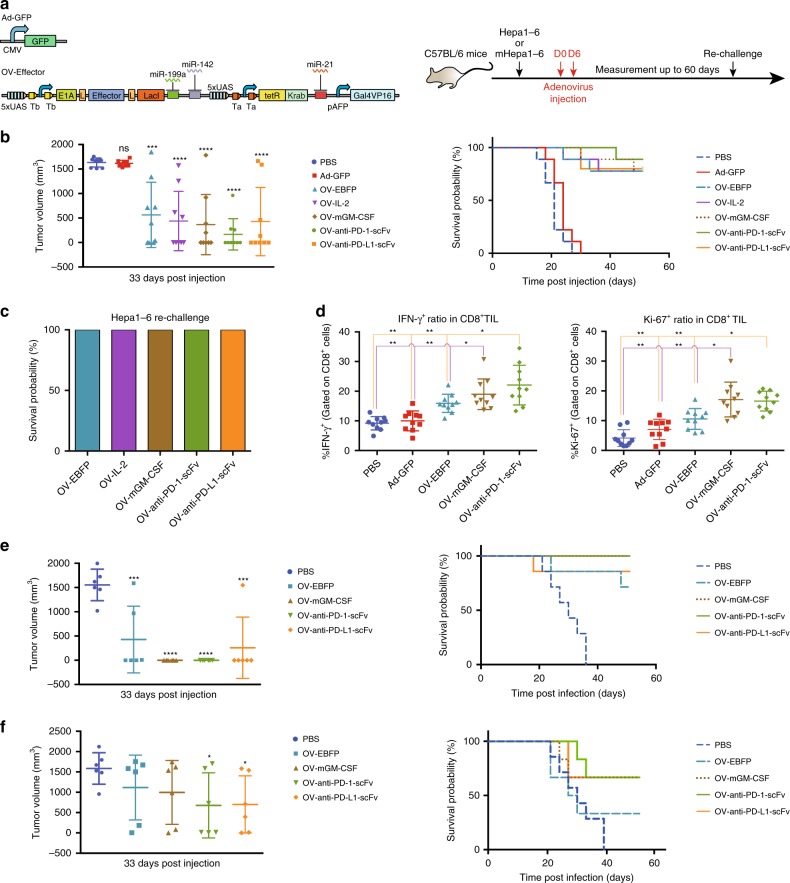
Fig. 6.
Effect of synthetic oncolytic adenovirus in immune-competent mouse models. a The schematic diagram of non-replicable adenovirus (Ad-GFP) and OV-EBFP without the viral backbone. The experimental design of immune-competent mouse experiments is shown on the right. b Each mouse was intratumorally injected with 1 × 10⁹ VP of indicated Ad-GFP or OV-Effector twice in one week right after the size of Hepa1-6 tumor reach to 100 mm3. PBS was used as a negative control. Tumor volume (left) and survival ratio curve (right) are shown (n = 9 or 10) at the 33rd day post injection. c Re-challenge survived mouse (n = 5 ~ 7) with 1 × 10⁶ Hepa1-6 cells in the contralateral position away from the first transplantation site 60 days after initial treatments. d The frequency of IFN-γ+ (left panel) and Ki-67+ (right panel) cells among tumor infiltrating CD8+ T cell in Hepa1-6 bearing mice (n = 10) at 14 days after treated with 1 × 10⁸ VP of indicated viruses. e 1 × 10⁹ VP of indicated Ad-GFP or OV-Effector were injected into mHepa1-6 bearing mice twice in one week right after the size of tumor reach to 100 mm3. PBS was used as a negative control. Tumor volume (left) and survival ratio curve (right) are shown (n = 6) at the 33rd day post injection. f 1 × 10⁷ VP of indicated Ad-GFP or OV-Effector were injected into mHepa1-6 bearing mice twice in one week right after the size of tumor reach to 100 mm3. PBS was used as a negative control. Tumor volume (left) and survival ratio curve (right) are shown (n = 6) at the 33rd day post injection. Student’s t-test was performed. Data are shown as mean ± s.d., *P < 0.05, **P < 0.01, ***P < 0.001, ****P < 0.0001. Source data are provided as a Source Data file

