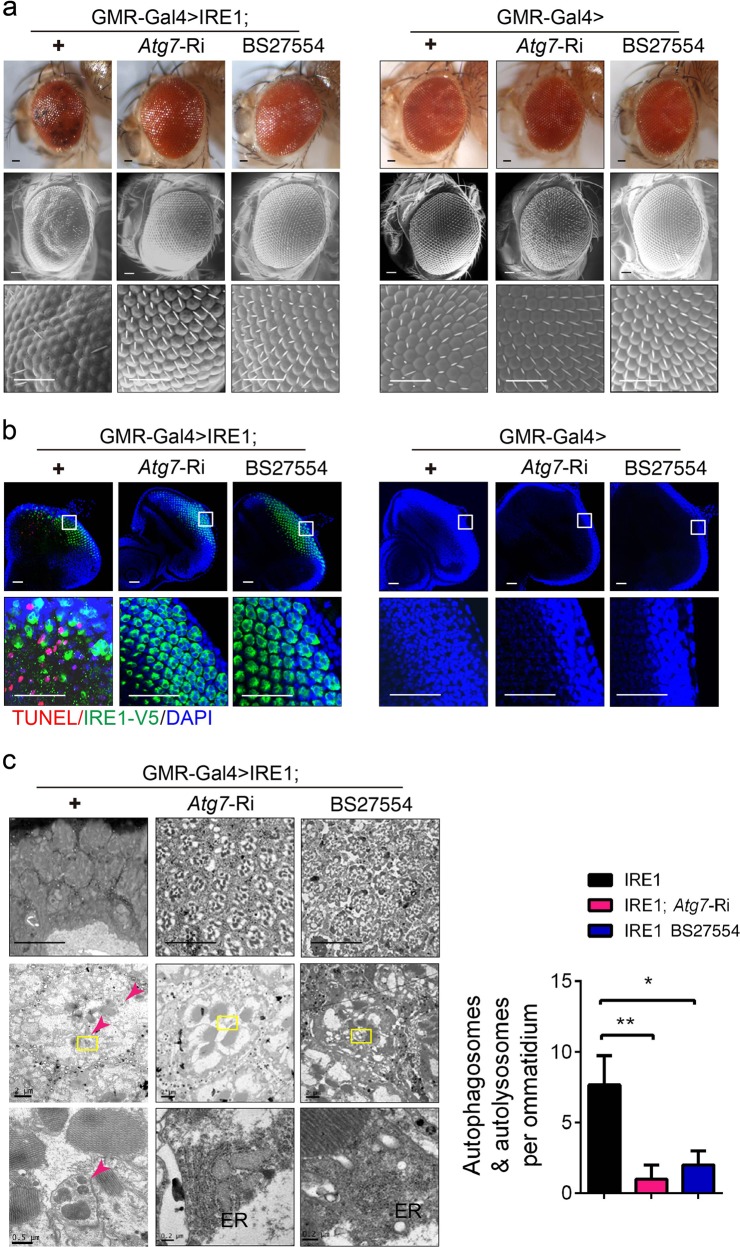
Fig. 3. Autophagy is required for IRE1-induced neuron death.
a Representative light microscopy (top) and SEM (middle and bottom) images of external eyes from adult GMR-Gal4 > IRE1, GMR-Gal4 > IRE1;Atg7-Ri and GMR-Gal4 > IRE1;Atg8b-Ri flies versus GMR-Gal4 > +, GMR-Gal4 > Atg7-Ri and GMR-Gal4 > Atg8b-Ri flies (n = 5–8 flies/genotype). Scale bar represents 50 µm. b Cell death analysis of larval eye discs of the indicated lines. Shown are representative images of TUNEL and DAPI staining along with IRE1 immunostaining with the enlarged regions indicated (n = 20 flies/genotype). Scale bar represents 30 µm. c Representative light microscopy images of tangential sections of adult eyes stained with toluidine blue (top panels) and TEM micrographs of the tangential section of an ommatidium (middle and bottom; Scale bars, 2 µm, 0.5 µm, and 0.2 µm) from the indicated lines (n = 3–5 flies/genotype). ER endoplasmic reticulum. Arrows indicate autophagosomes/autolysosomes, which were quantified from two independent experiments and are shown as mean ± s.e.m. (n = 3–5 flies/genotype). *P < 0.05, **P < 0.01 by Student’s t test. Scale bar represents 25 µm

