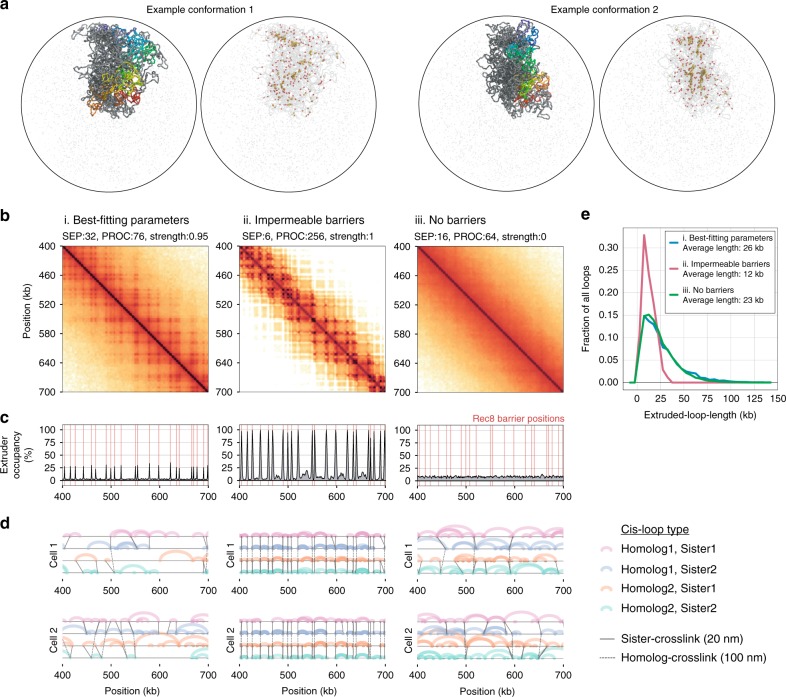
Fig. 4.
Polymer simulations of loop extrusion with varying barrier strength elucidate the heterogeneity of meiotic loops. a Two example conformations (top and bottom) for best-fitting simulations, which highlight: (left) one chromatid coloured from start (red) to end (blue); (right) extruders (yellow), extrusion barriers (red) and extruders paused at barriers (orange). b Simulated contact maps for the indicated region of chromosome 13 for: (i) best-fitting simulations, (ii) simulations with relatively stable loops between neighbouring Rec8 sites (barrier strength = 1 and high processivity), and (iii) no barriers, as in Fig. 3d. c Simulated ChIP-seq profiles for the indicated region of chromosome 13. Best-fitting simulations (i) display occupancy well below 100% at Rec8 sites. Simulations with stable loops (ii) display highly occupied Rec8 sites. Simulations without barriers (iii) have homogenous Rec8 occupancy across the genome. d Positions of extruded loops (arcs) sister crosslinks (solid black lines) and homologue crosslinks (dashed lines) for four chromatids in two separate cells, showing how the simulated Hi–C maps and ChIP-seq profiles emerge from the stochastic positioning of extruded loops from cell-to-cell. e Histogram of extruded loop lengths for indicated parameters (i, ii, iii)

