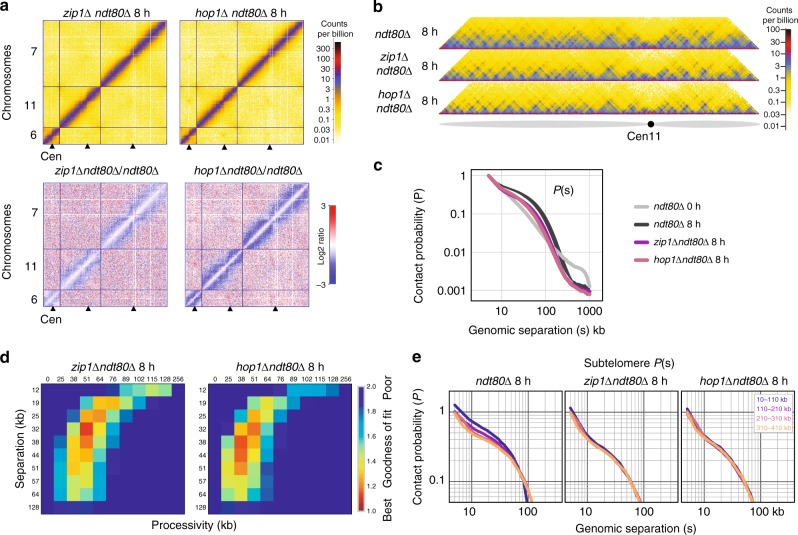
Fig. 5.
Hop1- and Zip1-dependent compaction of Rec8-dependent loops. a Top: Hi-C maps for hop1∆ and zip1∆ (plotted as in Fig. 1a). Bottom: Log2 ratio of hop1∆ or zip1∆ over control (as in Fig. 1g). For interactive views of the full genome, see: http://higlass.pollard.gladstone.org/app/?config=TTBGu5DDR0SHAa09zrjTXA. b Hi–C contact maps of chromosome 11 for hop1∆ and zip1∆ plotted at 2 kb bin resolution, showing near-diagonal interactions, as in Fig. 2a. c Contact probability versus genomic distance, P(s), for G1, ndt80∆, hop1∆, zip1∆. Shaded area bounded above and below by ndt80∆ replicas. Average between two replicas for zip1∆ and one sample for G1 and hop1∆ are shown. d. Goodness-of-fit for simulations without homologue crosslinks with a fine grid of processivity versus separation at barrier strength 0.95 zip1∆ and hop1∆. e. Contact probability over genomic distance, P(s), averaged over all chromosome arms stratified by distance from the telomere

