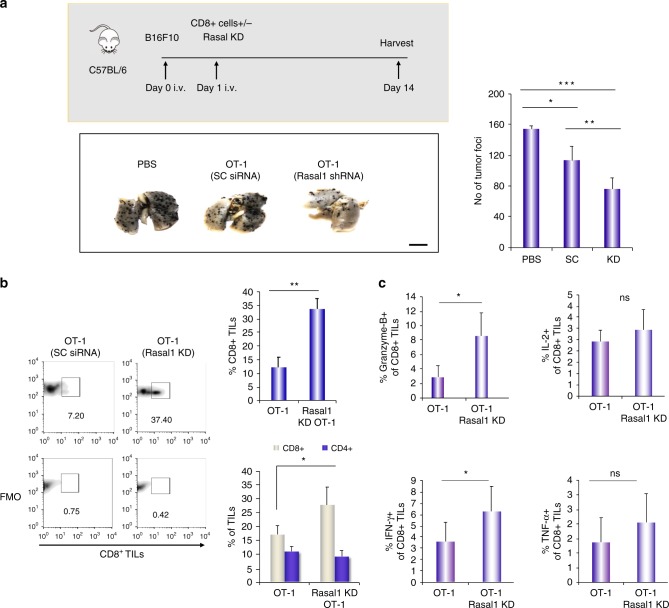
Fig. 7.
Rasal1 KD T cells show enhanced rejection of B16 tumors and the increased presence of activated CD8 + TILs. a Schematic of B16 melanomas tumor experiment. Histogram of B16 tumor foci at day 14 in control versus or mice receiving OT-1 cells with control scrambled esiRNA or with Rasal1 esiRNA (n = 4 per group, upper panel). Lower panel: representative image of B16 tumor lungs from each group. Right panel: histogram showing Rasal1 KD reduction of tumor foci in pulmonary B16 metastasis (numbers of tumor foci in lungs) (n = 3) (scale bar, 10 mm). b Rasal1 KD adoptive cell transfer results in a major increase in CD8 + TILs in B16 tumors. Left panel: FACs histograms showing presence of CD8 + TILs in tumors. SC scrambled siRNA, Rasal1 KD Rasal1 siRNA. Right upper panel: histogram showing percentage of CD8+ TILS; lower right panel: percentage (%) of CD4 vs CD8 T-cells in lung tumors of B16 animals. c Rasal1 KD ACT results in an increase in the GZMB and interferon gamma expressing CD8 + TILs in B16 tumors. Histograms showing % of granzyme B (GZMB), IFN-γ, IL-2, and TNF-α expressing CD8 + TILs. Plots show mean with ± SD. p-values were calculated by unpaired t test. *p < 0.05, **p < 0.01, ***p < 0.001

