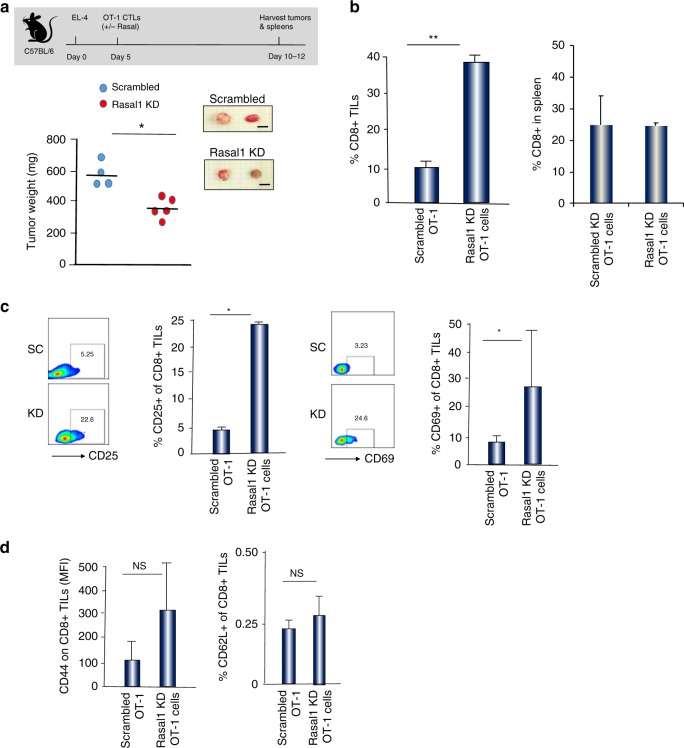
Fig. 8.
Rasal1 KD T cells show reduced EL-4 tumor size concurrent with an increase in the presence of activated CD8 + TILs. a Upper panel: schematic of EL4 solid tumor experiment. Lower panel: quantification of tumor size in mice receiving OT-1 cells expressing control scrambled siRNA or Rasal1 KD siRNA T cells (n = 4 per group, lower panel). Upper inset panel shows representative images of some EL4 tumors from each group (scale bar, 5 mm). b Histogram showing an increase in the percentage of CD8+ TILs in mice injected with CD8 + Rasal1 KD relative to scrambled siRNA T cells (left panel). No increase was seen in the spleens of these mice (right panel). c Histograms showing an increase in the expression of CD25 and CD69 on CD8 + TILs from mice injected with control scrambled siRNA or with Rasal1 KD siRNA T cells. d Histograms showing the MFI values for CD44 expression (left panel) and the percentage of CD62L-positive CD8 TILs (right panel) from mice injected with scrambled siRNA or Rasal1 KD siRNA T cells

